Полная версия
Numbers: B2+

Often money calculations will involve the use of percentages and fractions. You will learn about these in Chapter 6.
Glossary
estimate If you estimate a quantity or value, you make an approximate judgement or calculation of it.
expenditure Expenditure is the spending of money on something, or the money that is spent on something.
value In mathematics, the value of a symbol or letter is the amount represented by it.
The value of a digit in a number depends on its position in the number. In the following amounts of money, the digit 4 has a different meaning:
14p or £0.14 four pence 45¢ or 0.45¢ forty cents £14.27 four pounds $49.99 forty dollars £458.60 four hundred pounds €4,700 four thousand euros $46,500 forty thousand dollarsA place value diagram may help to remind you how to recognize the value of amounts of money. The highest number in the group is the maximum and the lowest is the minimum.
$10,000 €1,000 £100 $10 £1 . ¢1/10 1/100p ten thousand dollars one thousand euros one hundred pounds ten dollars one pound . ten cents one penceEstimating can be a useful skill when you are calculating your monthly expenditure because you can work out approximately how much your total bill will be without adding up all of the individual values. Estimating involves rounding prices up or down to the nearest ten pounds, dollars or euros so that you can work out the total more easily.
This list shows the actual expenditure with the estimated value for each cost:
Monthly Expenditure Actual cost Estimated cost Accommodation £512.40 £510 Food and drink £148.60 £150 Travel £31.52 £30 Clothes £56.80 £60 Entertainment £86.53 £90So, when we add up the actual prices the aggregate total price for our shopping is £835.85 and the estimated cost is £840.
Glossary
round up/down If you round an amount up or down, you change it to the nearest whole number or the nearest multiple of 10, 100, 1,000, and so on.
aggregate An aggregate amount or score is made up of several smaller amounts or scores added together.
Measurements
Taking measurements is about finding a number that shows the amount or size of something. We are most often interested in measuring temperature, length, speed, time, capacity and mass. To make an accurate measurement, you would need to choose an appropriate measuring device and use the correct type of units on a scale. Here are some examples:
Glossary
capacity The capacity of a container is its volume, or the amount of liquid it can hold, measured in units such as litres or gallons.
mass In physics, the mass of an object is the amount of physical matter that it has.
Measurement Measuring device Units temperature thermometer degrees Celsius (°C) or degrees Fahrenheit (°F) length ruler or tape measure centimetres (cm), metres (m) or kilometres (km) speed speedometer metres per second (m/s) or kilometres per hour (km/h) time clock or stopwatch seconds (sec), minutes (min) or hours (hr) capacity measuring jug millilitres (ml) or litres (l) mass weighing scales grams (g) or kilograms (kg)
Exercise 1
Match the correct unit of measurement with each item to be measured.
Unit of measurement Item being measured degrees Celsius (°C ) distance between London and Paris kilometres (km) weight of a pencil kilometres per hour (km/h) time taken to count to ten seconds (sec) temperature of a cup of coffee millilitres (ml) amount of orange juice in a glass grams (g) speed of a trainThere are a number of key terms that are useful to learn when working with numbers and data. Test your knowledge of these by completing the following exercises.
Exercise 2
Use the words in the box to complete these sentences. You might need to change the form of the word.
accurate calculation fraction measurement
aggregate / total capacity mass percentage
approximately estimated maximum / minimum round up / down
1 The ________of 9, 10, 24, 6, 8, 5 is 62. It is also known as the ________.
2 The ________of the lecture theatre is 200 people.
3 Economic forecasters have ________that the economy will grow by 0.5% next year.
4 There are ________300,000 international students studying in the UK.
5 The spreadsheet automatically ________or ________to the nearest whole number.
6 The ________loan available is £5,000 and the ________loan available is £500.
7 The ________of a bowling ball is 7.25 kilograms.
8 ________measurements are essential in many scientific experiments.
Exercise 3
Use another word in the box in Exercise 2 to describe each item below.
1 1/3 ________
2 245 × 6 ________
3 98% ________
4 100 ml ________
Exercise 4
Put the word in brackets into the correct form in each of these sentences.
1 The closest ________was 2 years 4 months. (estimate)
2 There are a number of different ways to ________an average. (calculate)
3 There are ________1.3 billion people in China. (approximate)
4 The ________of another variable completely changed the outcome of the experiment. (add)
5 The values were ________and then used to find the average. (total)
6 The answers were cross-checked to ________predict the outcome. (accurate)
What is statistics?
Every day in our lives, we hear and read about many different types of information in the form of data. Data can tell us interesting and important details about the world around us but it can be challenging to understand the facts and figures.
Statistics is a mathematical science that helps us to make sense of data that has been counted, measured, asked about or observed. It involves four main activities:
Glossary
method A method is a particular way of doing something.
technique A technique is a particular method of doing an activity, usually a method that involves practical skills.
Collecting data – first of all, we decide what type of data we are interested in, which method we shall use to collect the data, and where we would like to collect it from.
Organizing data – we use a range of different techniques to summarize the data we have collected so that we can see interesting features or patterns in the information.
Interpreting data – we use the results of calculations to help us make comparisons about different sets of data, to answer questions and make decisions about the world around us.
Glossary
feature A feature of something is an interesting or important part or characteristic of it.
Presenting data – when we have found out interesting facts about our data, then we will need to display and present the information to other people so that they can understand our conclusions.
Exercise 5
Choose a newspaper or news-related website and look for reports that use statistics to help explain the main points of the article. Think about these questions:
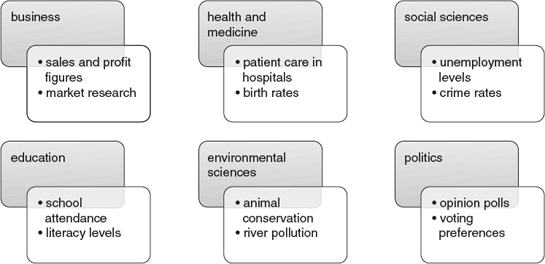
Statistics is important in many different subject areas. The following diagram lists some examples of the type of data that might be collected and used:
Some terminology
In statistics, we use two key words: variable and observation. It is important to understand the difference in their meanings. A variable is a characteristic or an attribute that can have different values; an observation is the value of a variable that has actually been counted, measured or observed. Some variables are shown below, with a list of possible observations next to each one.
Glossary
variable A variable is a factor that can change in quality, quantity, or size, which you have to take into account in a situation.
characteristic The characteristics of a person or thing are the qualities or features that belong to them and make them recognizable.
attribute An attribute is a quality or feature that someone or something has.
Variable Observations favourite colour purple, blue, orange number of pets 3, 1, 0 time spent reading 2 hours, 1 hour number of children in a family 1, 5, 2 eye colour brown, blue number of letters in a name 10, 4, 8The observations for a variable can be described as quantitative or qualitative, depending on what the information is about. Quantitative data is something which can be measured or counted using a number. Qualitative data represents a characteristic that uses words to describe it but does not use any numbers.
Examples of quantitative variables are:
Examples of qualitative variables are:
Exercise 6
Match the words on the left to their definitions on the right.
1 A variable a Data which can be measured or counted using a number. 2 An observation b The value of a variable that has actually been counted, measured or observed. 3 Quantitative c Data representing a characteristic that uses words to describe it but does not use any numbers. 4 Qualitative d A characteristic or an attribute that can have different values.Exercise 7
State whether each of the following variables is quantitative or qualitative:
1 number of pages in a book
2 names of students in a class
3 hair colour
4 weight of apples in a bag
5 height of trees in a park
Exercise 8
Answer these questions.
1 Explain the difference between a quantitative and a qualitative variable.
2 Give an example of each type of variable.
3 Explain why:
‘type of tree’ is a qualitative variable
‘number of pupils in a class’ is a quantitative variable
Exercise 9
Without looking back at the section ‘What is statistics?’, put these statistical stages into the correct order.
1 organize data
2 present data
3 collect data
4 interpret data
Exercise 10
Use the words in the box to complete these questions about the stages above.
data features patterns sets of data
display method present technique
1 What type of ________are we interested in?
2 Which data collection ________shall we use?
3 What ________shall I use to summarize my data?
4 What interesting ________or ________can I see?
5 What questions do my ________answer?
6 What is the clearest way to ________and ________my data?
Exercise 11
Match the questions in Exercise 10 to the stages in Exercise 9.
Using spreadsheets
You can store, organize and present your data in a computer program called a spreadsheet.
Glossary
grid A grid is something which is in a pattern of straight lines that cross over each other, forming squares. On maps the grid is used to help you find a particular thing or place.
row A row of things or people is a number of them arranged in a straight line.
intersection An intersection is a place where lines or roads meet or cross.
cell A cell is one of the small squares in a chart or spreadsheet into which you can add a single piece of data.
A spreadsheet appears as a table or grid containing a set of rows and columns. Rows are displayed horizontally on the grid and each one is labelled with a number (1, 2, 3 …); the label for each column is a letter (A, B, C …) and columns are displayed vertically across the grid.
The empty spreadsheet grid shown below has eight rows and five columns, but a spreadsheet in a computer program will have many, many more rows and columns.
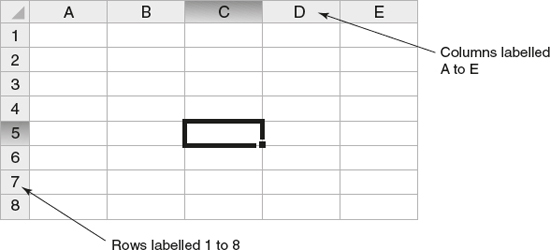
The intersection of a row and a column is called a cell. Each cell has its own name, which consists of the letter of the column followed by the number of the row. The highlighted cell in the spreadsheet grid shown above is called C5 – it is where column C and row 5 meet.
Tip

Exercise 12
Look at the section of a spreadsheet below, and answer the questions.
A B 1 Subject Grade 2 Statistics 80% 3 Information Systems 67% 4 Sociology 65% 5 Academic Skills 53% 6 Business and Management 74%1 What is contained in the following cells?
a A6
b B3
2 What is the reference for the cells that contain the following?
a The number ‘53%’
b The word ‘Statistics’
The data values in each spreadsheet cell can be displayed in different ways depending on how the information is described. You can use: