Полная версия
Scotland
An even closer look at the last of these cold-to-warm changes (Fig. 34, black line) allows us to appreciate better the glaciation which has been responsible for much of the recent modification of Scottish landscapes. Starting with the Ipswichian interglacial, the Greenland curve shows fluctuations in the oxygen isotope ratios that were frequent and short-lived, though generally implying increasingly cool conditions. This part of the record is helping to define the Devensian glaciation and shows clearly the Late Glacial Maximum (LGM) at between about 30,000 and 20,000 years ago. Following this, the beginning of the Holocene warm period (about 10,000 years ago) is also clear.
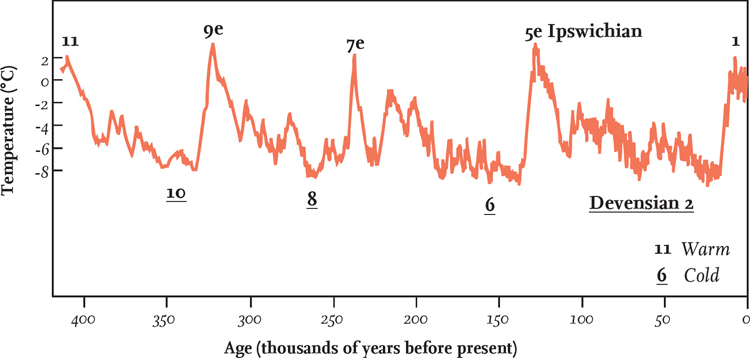
FIG 33. Isotopic temperature of the atmosphere changing through the last 400,000 years, measured from ice cores taken from Vostok, Antarctica.
The link between oxygen isotopes, temperature and sea level becomes clear if we compare oxygen isotope ratios from the Greenland ice (Fig. 34, black line) with sea-level data from tropical reefs in Papua New Guinea (Fig. 34, red line). The data show how colder climates are generally associated with lower sea levels, reflecting the locking up of oxygen-16-rich water in land-based ice sheets during these colder times.
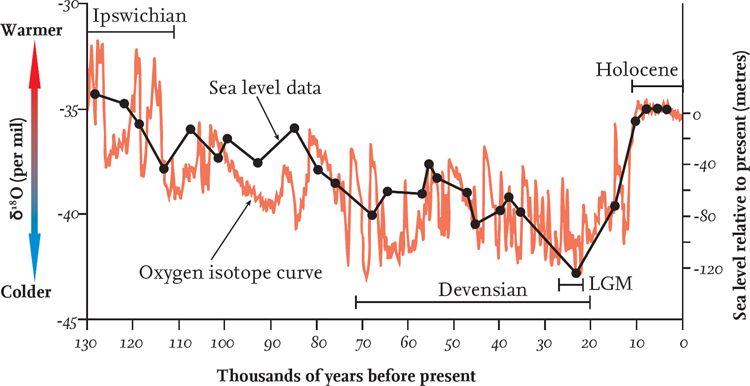
FIG 34. Black line: oxygen isotope ratios sampled from cores taken in the Greenland ice sheet. Red line: sea-level determinations from tropical reefs in Papua New Guinea.
At its maximum extent the Devensian ice sheet covered the whole of Scotland, including the western and northern islands. It also covered most of Wales and northern England and extended as far south as the Midlands, the Bristol Channel and the Wash. Maintaining a thickness of many hundreds of metres, it joined Norwegian ice on the Norwegian side of the northern North Sea (Figs 35, 36).
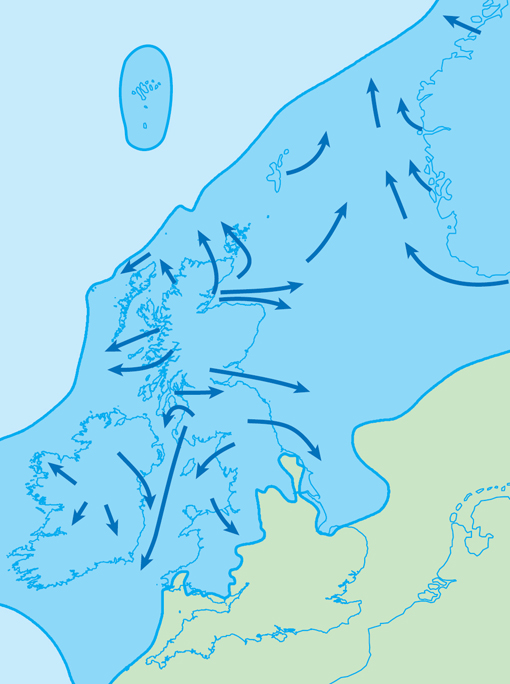
FIG 35. One estimate of the maximum extent of the Devensian ice sheet, with generalised ice-flow directions. At a later stage the Scottish and Norwegian ice became separated.
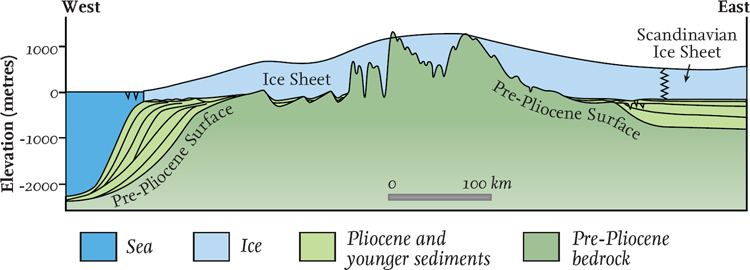
FIG 36. West-to-east generalised cross-section at the maximum extent of the Devensian ice sheet.
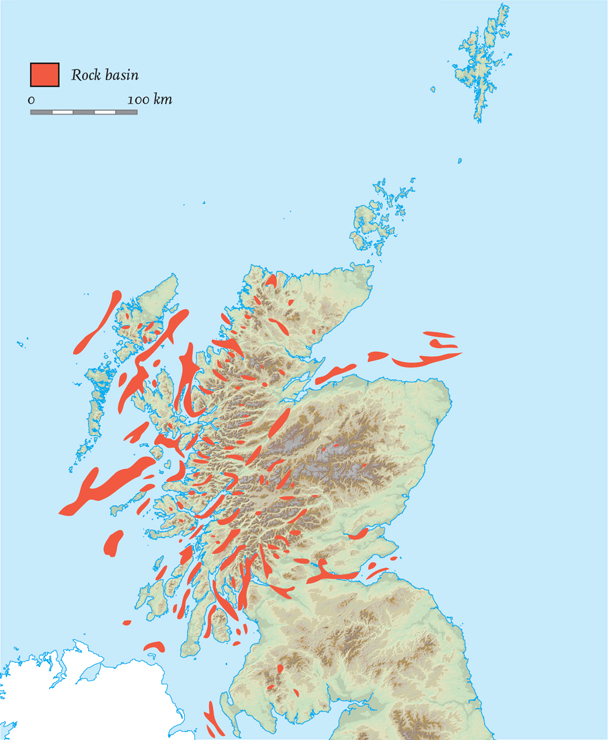
FIG 37. The larger rock basins are the result of erosion by Quaternary ice streams.
There is abundant local evidence in Scotland of the modification of valleys by glaciers and ice streams, which deepened and opened out the valley profiles, removing spurs and side ridges, to produce classic U-shaped glacial troughs. These troughs are very different from the V-shaped cross-sections and sinuous forms typical of river erosion (see Fig. 8, Chapter 2). This modification work is likely to have taken place in every one of the Ice Age glacial stages that occurred in Scotland, and the same processes have also been responsible for the elongate rock basins now recognised in many offshore areas (Fig. 37).
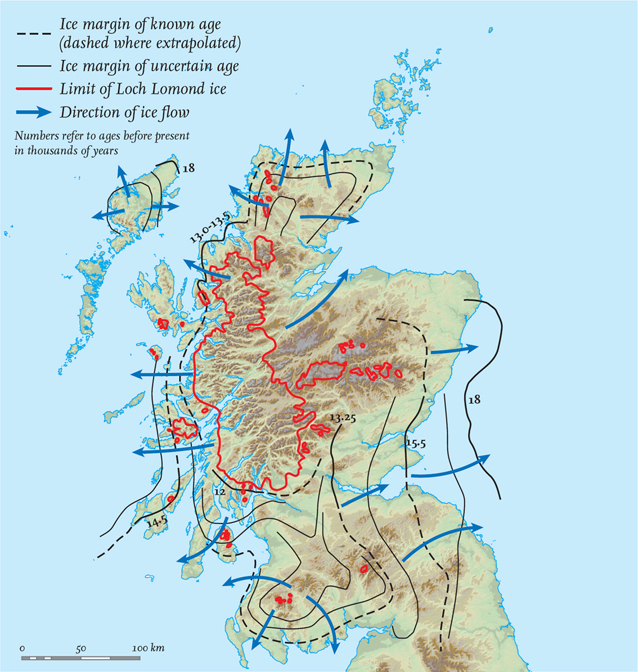
FIG 38. Shrinking of the main Scottish ice sheet over the last 18,000 years.
Episode 12: since the Devensian Late Glacial Maximum
The period of rather more than 20,000 years since the Late Glacial Maximum represents one of the most recent phases of intense landscape evolution (Fig. 38). Because this was a period when ice cover was generally decreasing, local evidence is often preserved that would have been destroyed during a major phase of advancing ice. The last 10,000 years is often referred to as either the Holocene or the Flandrian Interglacial, the latter name emphasising that the ice may well return.
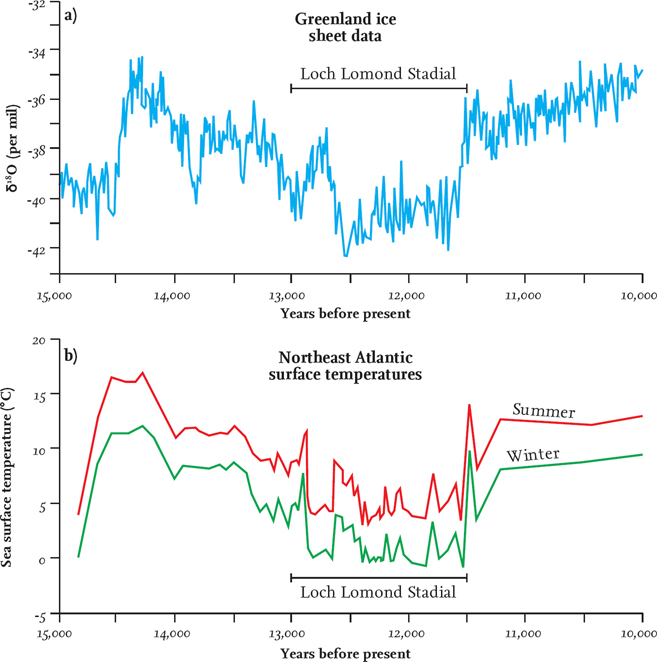
FIG 39. Oxygen isotope variation from (a) Greenland ice cores and (b) Northeast Atlantic sea-surface temperatures, both over the time period from 15,000 to 10,000 years BP (before present).
The record of climate change since the Late Glacial Maximum has been greatly illuminated by the same use of oxygen isotopes as described above for Episode 11. One important advantage in working on these recent times is that it is possible to seek additional, independent information for the ages of samples. Some of this dating may be based on comparison of plant remains, particularly pollen from cores extracted by drilling into lake beds or peat-rich wetlands. Other dates come from the analysis of radioactive carbon, whose rapid decay rate makes it a powerful tool in dating material that is so relatively young.
Although the dominant feature of global climate change over the past 20,000 years has been the general warming trend, detailed research has established a complex pattern of climatic fluctuations. In Scotland, the most important of these fluctuations is the Younger Dryas cold phase, also known as the Loch Lomond Stadial (Fig. 39). During this time, between about 13,000 and 11,500 years ago, the generally retreating ice re-advanced to form an icecap covering much of the western Highlands (Fig. 38, red line). The local effects of this Loch Lomond Advance are particularly clear within the area of western Scotland where moraines were pushed forward.
SEA-LEVEL CHANGE
In Areas with coastlines, some of the freshest features of the landscape have formed since the Late Glacial Maximum as a result of changes in sea level. Two different mechanisms have combined to produce these changes:
(1) Worldwide ocean-volume changes of the water occupying the world’s ocean basins. These have been the direct result of the locking-up or releasing of water from land-based ice sheets as they grow or shrink due to climate fluctuations. The water itself may also have expanded or contracted as its temperature changed. These worldwide processes are often grouped together as eustatic.
(2) Solid Earth local movements which have resulted in the local raising or lowering of the ground surface relative to the level of the sea. These movements were responses to changes in the local temperature or stress pattern within the Earth. Ice-sheet melting unloaded the crust of the Earth locally, resulting in uplift, while ice-sheet growth loaded the crust, resulting in subsidence. These effects are often referred to as isostatic adjustments of local sea level (see Chapters 2 and 3).
Some parts of the world, for example many tropical areas, have been free of ice since before the Late Glacial Maximum and so have avoided any solid Earth movements associated with loading and unloading by ice. Records of changing sea level from these areas can therefore be used to estimate worldwide (eustatic) changes in the volume of the world’s oceans since the Late Glacial Maximum. Figure 40 shows that eustatic sea level has risen by about 120 m over the past 18,000 years, beginning with a slow, steady rise until about 12,000 years ago, followed by a rapid increase until about 6,000 years ago, and then another slow, steady phase up to the present day.
Curves of local sea-level change for any area can be estimated (relative to the present) by recognising and dating various features that indicate elevations in ancient coastal profiles. These features, preserved in the rocks either above or below the present sea level, include former erosional cliff lines, wave-cut platforms and ancient tidal, estuarine or freshwater deposits. The similarity or otherwise of such curves to the eustatic curve (Fig. 40) depends on whether the areas in question have been subjected to any localised solid Earth movements, such as ice loading or unloading.
Two examples of British sea-level curves, relative to the present, illustrate how the local uplift and subsidence history varies for different coastal areas around Britain. In the Thames Estuary, local evidence shows that a rise of some 40 m has taken place through time over the last 10,000 years, at first very rapidly but then more slowly between about 6,000 years ago and the present (Fig. 41, red circles). Modelling of the processes involved, incorporating estimates of eustatic (global) sea-level change and local solid Earth movements, gives a fairly good match to the observational data (Fig. 41, black line).
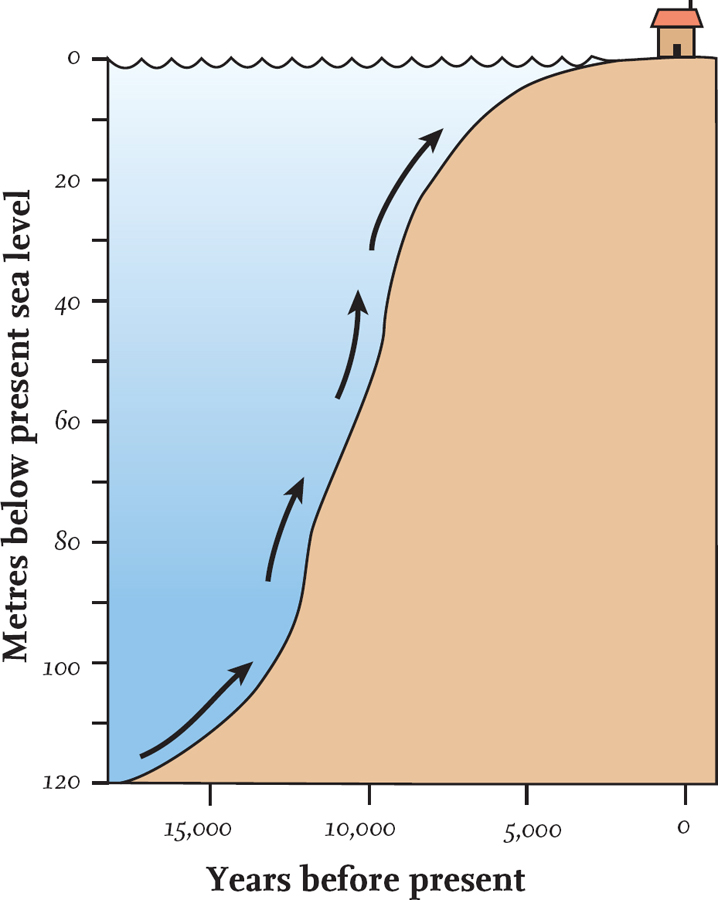
FIG 40. Generalised change of worldwide (eustatic) sea level over the past 18,000 years. (After Van Andel 1994, Fig. 4.11)
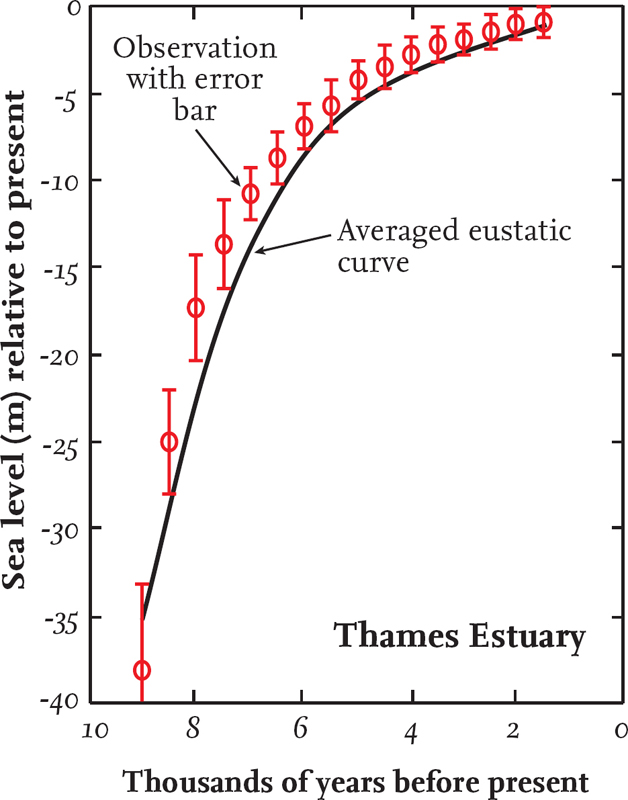
FIG 41.Relative sea-level curve for the Thames Estuary.
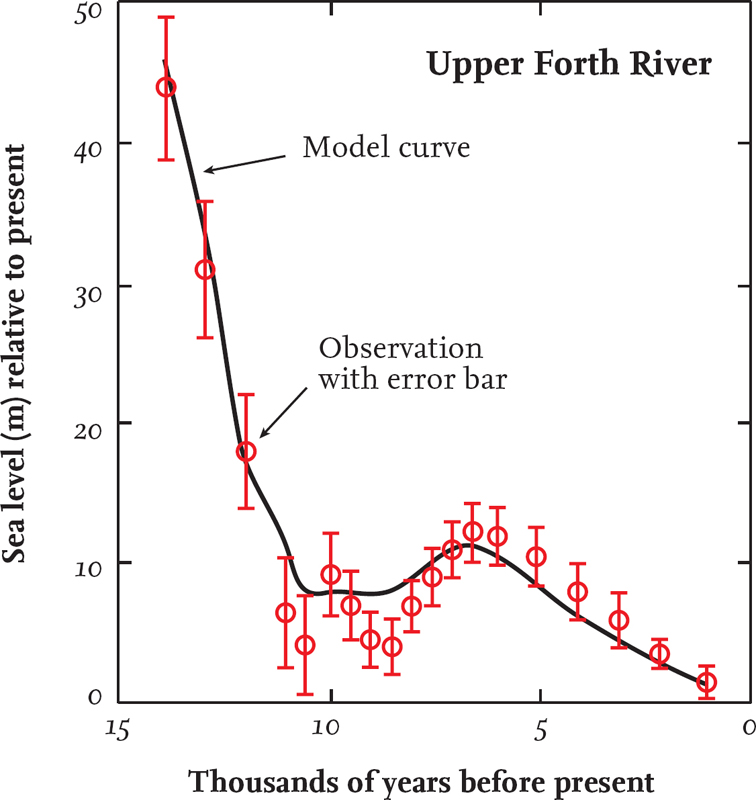
FIG 42. Relative sea-level curve for the upper River Forth at Arnprior.
Our second example of relative sea-level change comes from the upper River Forth and is quite different. It shows that there has been a fall of relative sea level of about 50 m over the past 15,000 years, so that former coastline features are now visible well above the present-day coast (Fig. 42, red circles). This type of curve is common in Scotland and, given the ~120 m worldwide rise in sea level shown in Figure 40, it is clear that the crust of the Forth region must have been subjected to significant uplift (~170 m) in order to produce the curve shown in Figure 42. This uplift is largely the result of isostatic rebound due to unloading of the crust as the ice retreated.
In some curves, as with the upper Forth, oscillations in the curve represent changes in the rates at which the two mechanisms of change were operating. Such changes may leave characteristic coastline features in the landscape, which will be considered in the Area descriptions.
At larger scales, it is useful to consider average rates of crustal movement over a given time period, which can then be plotted as contour maps. The contours shown on Figure 43 are based on estimates of local elevation changes averaged over roughly the last 5,000 years, attempting also to allow for the effects of eustatic sea-level variations. Additional support for this approach comes from data from tide-gauge studies, collected over the last 200 years, which show some consistency with this pattern.
Although our two local studies in the Thames region and the upper Forth (Figs 41, 42) involve a rather longer timescale than the regional analysis (Fig. 43), all three studies highlight the clear contrast between crustal movements in southeastern England and those in western and central Scotland. These variations have been produced by differences in ice-sheet thickness and extent during the last (Devensian) glacial.
The distinctive rise of the land of Scotland relative to sea level lends itself to another approach to the study of sea-level change. Figure 44 shows a plot of the elevations and gradients of various old shoreline features that are now above present-day sea level across Scotland and northern England. These old shoreline features have clearly been uplifted, and those further inland have generally risen more than those near to the present-day coast, so that they now form a dome-like structure. This dome is broadly centred on Rannoch Moor, which was one of Scotland’s main ice centres during the last glaciation. We can therefore usefully identify a Rannoch Rebound Dome as an active feature of local Earth movement, resulting from unloading of the crust of western Scotland in response as the Devensian ice melted.
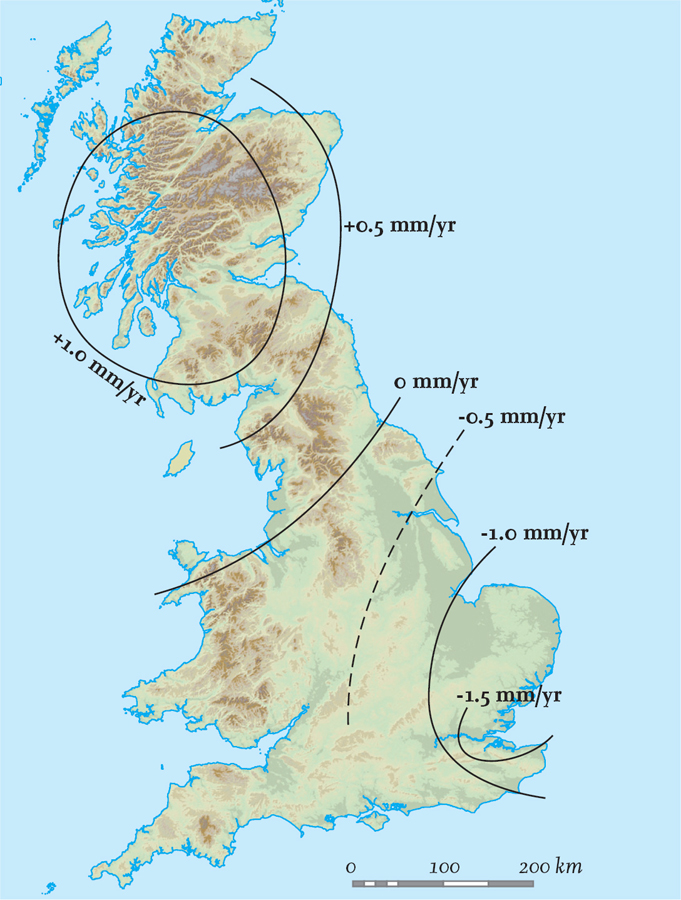
FIG 43. General trends of crustal movement, relative to sea level, averaged over the last 5000 years.
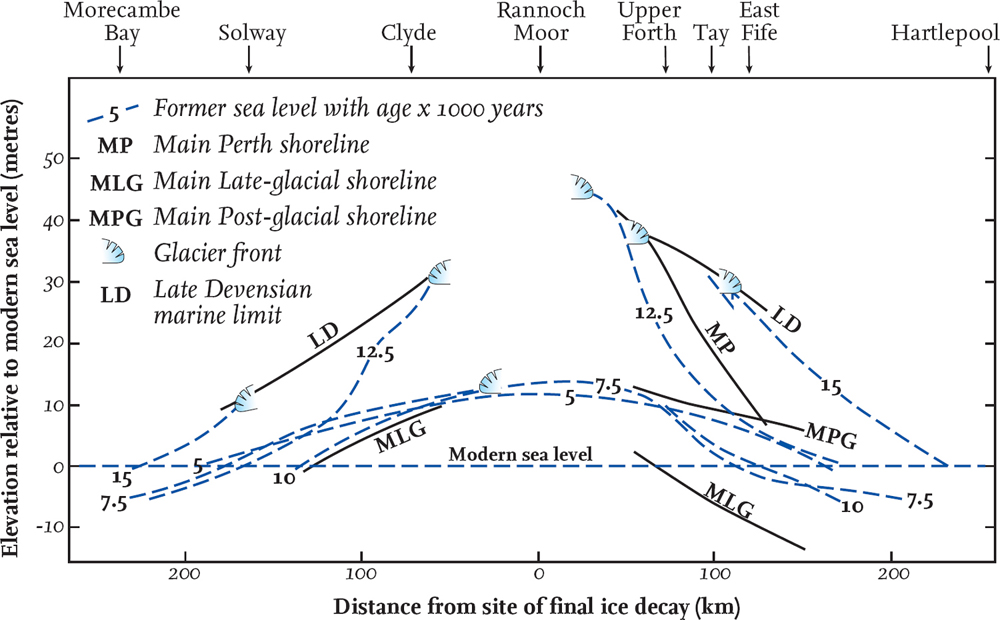
FIG 44. The elevations and gradients of various old shoreline features along a horseshoe-shaped traverse across northern Britain, suggesting the Rannoch Rebound Dome.
CHAPTER 6
Area 1: Galloway
AREA 1 EXTENDS FROM AYR in the northwest down to Dumfries in the southeast (Fig. 45). It lies mainly within the western half of the Southern Uplands, a terrain of rolling hills, bounded to the west by the Firth of Clyde and its numerous sandy bays. The Southern Uplands Fault crosses the northern half of the Area, separating the Southern Uplands from the generally lower-lying ground of the Midland Valley, with its volcanic hills and important coal reserves (Fig. 46).
People have inhabited this Area for thousands of years, and it was an important gateway between England and Ireland. There are many remains of human occupation dating from prehistoric times to the present day, ranging from Mesolithic fish traps to medieval burghs and castles. Another interesting feature of Area 1 is the unusual place names, particularly in the Southern Uplands themselves, where Old Norse, Gaelic and Celtic influences can be seen. Examples are the Rig of the Jarkness and the Dungeon of Buchan.
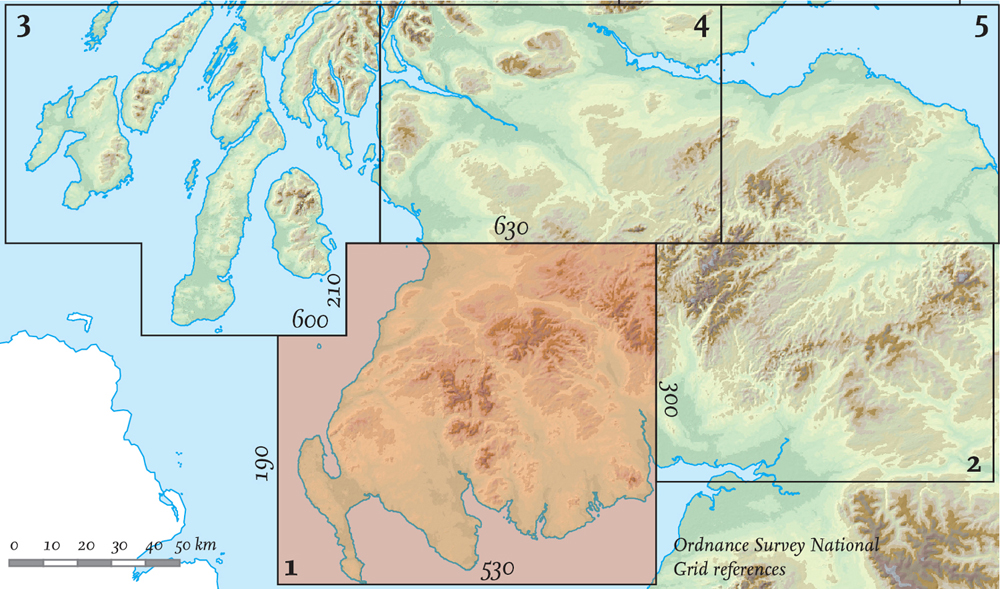
FIG 45. Location map for Area 1.
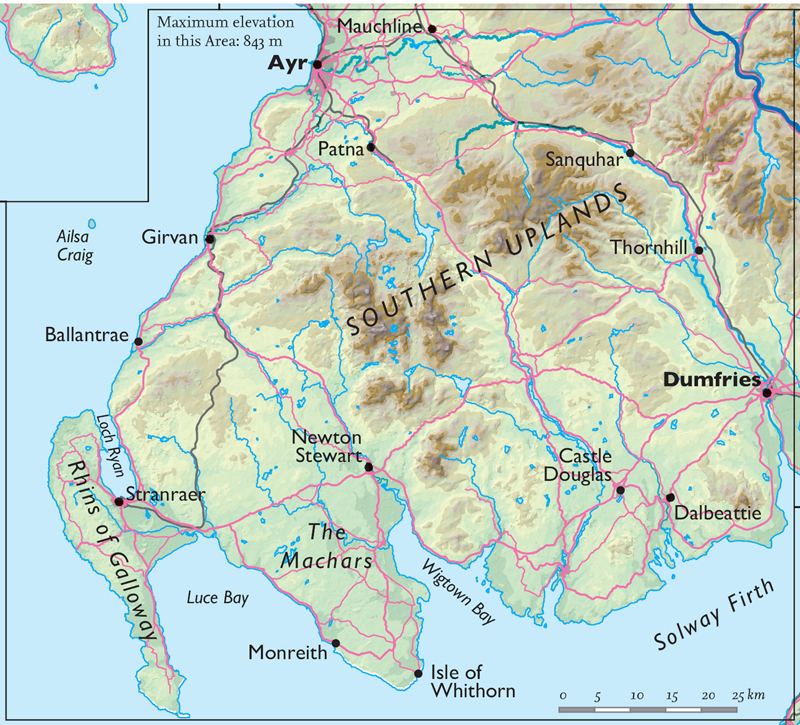
FIG 46. Natural and man-made features of Area 1.
STORIES FROM THE BEDROCK
Geologically speaking, Area 1 lies mainly within the Southern Uplands terrane, sandwiched between the Iapetus Suture in the south and the Southern Uplands Fault in the north (see Fig. 20, Chapter 4). The bedrock of the Southern Uplands (Figs 47, 48) is mostly altered Ordovician and Silurian sedimentary rocks, deposited between 490 and 420 million years ago on the floor of the Iapetus Ocean (see Chapters 1–5). The sediments which make up this bedrock were swept off a nearby continental shelf and down the continental slope in turbid (muddy, cloudy) currents – underwater avalanches, more dense than the surrounding sea water – that were probably earthquake-triggered. On reaching the flat ocean floor, the entrained sediments in each avalanche gradually settled – coarse sands first, followed by fine sand, and then the much slower deposition of clay and mud. In this way, each turbid current resulted in a graded bed, from coarse-grained at the bottom to fine-grained at the top, and as the process repeated itself many times, a thick sequence of such beds built up. Small amounts of limestone were also deposited, along with volcanic material such as pale ash layers. Graptolites – small, now-extinct marine animals – are common in the fine-grained sediments of the Southern Uplands. Their rapid evolutionary changes of form mean they have become very useful time markers for determining the relative ages of different sedimentary beds, especially when combined with studies of the folds and faults, in reconstructing the origins of the Southern Uplands.
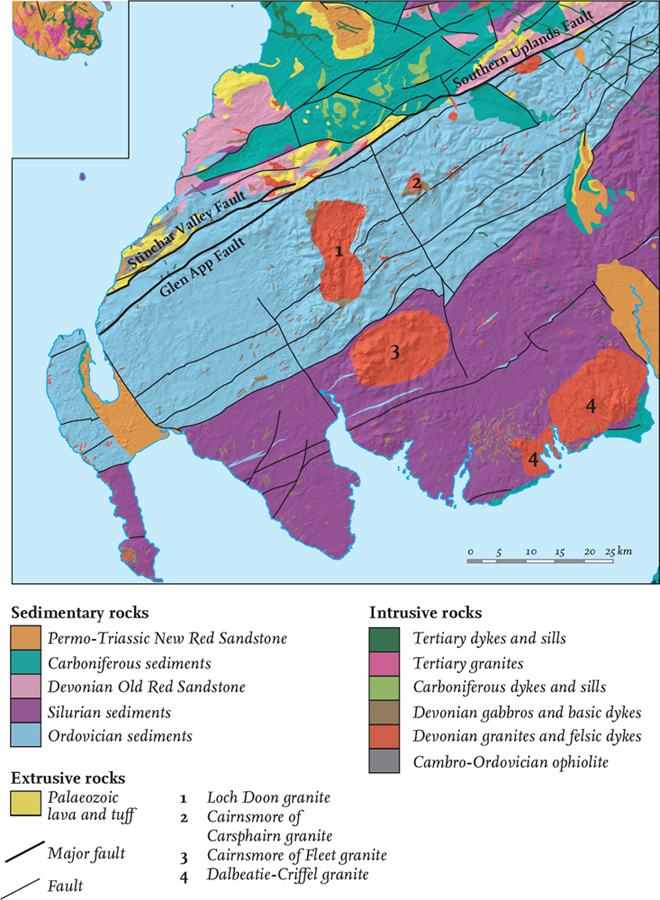
FIG 47. Simplified geology and hill-shaded topography for Area 1.
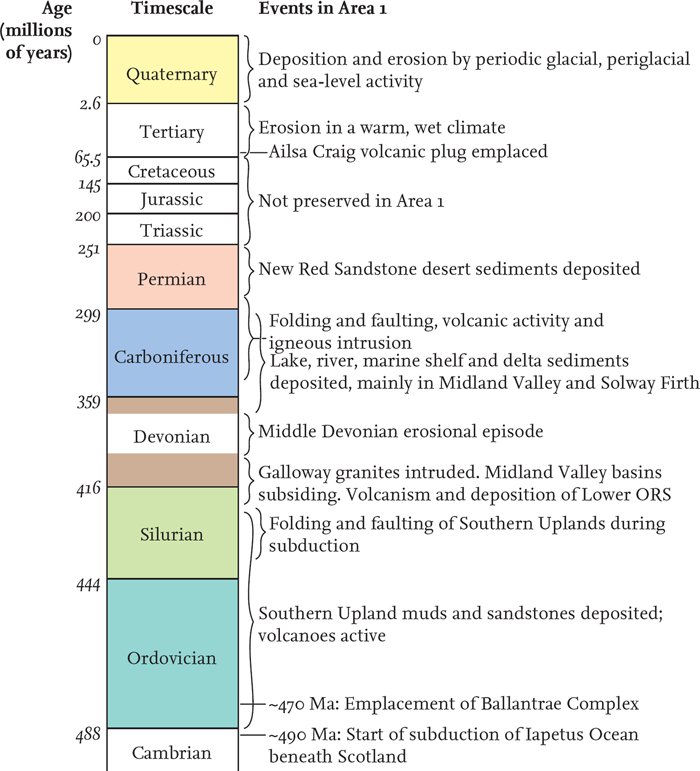
FIG 48. Timeline of bedrock and surface-layer events in Area 1.
Prior to the Caledonian mountain building, the crustal foundations of Scotland and England were separated by the Iapetus Ocean. Around 490 million years ago, this ocean began to be destroyed by subduction: oceanic crust moved down into the mantle beneath the Grampian Highlands, and then beneath the Midland Valley (see Chapter 4). A small fragment of this oceanic crust escaped subduction, being instead thrust up onto the margin of Scotland, to be ‘welded’ onto the Midland Valley by around 470 million years ago. Today, this small but intensively studied area of complexly interfolded rock units outcrops around Ballantrae, the so-called the Ballantrae Complex. Rocks characteristic of the deep sea and oceanic crust are found – sediments such as black shale and chert, basalt lavas with pillow structures, ash, sheets of dykes and upper mantle rocks. The latter originated at depths of up to 40 km in the Earth’s crust, and are today coarse-grained (mafic) gabbros and serpentinite.
The main deformation of the Southern Uplands terrane occurred during the later stages of the Caledonian mountain building, between the mid-Ordovician and the early Devonian. As oceanic crust continued to be subducted, the sediments which today make up the Southern Uplands were scraped off the ocean floor along a series of thrust faults and stacked up in a pile against the edge of the Midland Valley (Fig. 28). During this deformation, the sediments became tightly folded and weakly metamorphosed: fine-grained mudstone and siltstone became slate, while cement within sandstones recrystallised to produce a tough, hard rock (greywacke). Today, bedding in the Southern Uplands is aligned in a general northeast/southwest direction and dips very steeply to the southeast, and northeast/southwest faults divide the region into numerous fault blocks.
By the start of the Devonian (around 415 million years ago), the major deformation of the Southern Uplands had ceased and Scotland and England were welded along the Iapetus Suture. It was around this time that the major granite bodies of the Southern Uplands (Fig. 47) were emplaced: partial melting at the base of the thickened crust produced liquid magma, which then rose up into the upper crust where it slowly solidified to form coarse-grained igneous bodies (plutons). As the overlying rocks were subsequently removed by erosion, three major plutons were revealed in the Southern Uplands. The most northerly of these is the hourglass-shaped Loch Doon intrusion, said to be one of the finest examples in Scotland of a concentrically zoned pluton: the interior of the body is silica-rich (felsic) granite, separated from the outer silica-poor grey granodiorite which makes up most of the body by a transition zone. Similar well-developed concentric zonation is seen in the eastern half of the Criffel–Dalbeattie body on the south coast, although overall this body is much less compositionally evolved (i.e. it has a lower silica content) than the other Southern Uplands granites. It is also the most deformed: originally oval, its western part has been distorted southwards by complex faulting. Porphyrite dykes and sills commonly surround the main intrusion (e.g. at Black Stockarton Moor), made up of large crystals embedded in a fine, glassy groundmass. Between the two, the roughly oval Fleet pluton was intruded around 390 million years ago (Devonian) into a broad ductile shear zone, making it the youngest reliably dated Caledonian pluton in mainland Scotland (Fig. 49). It is also the most evolved of the Southern Uplands intrusions, consisting entirely of granite, and is the only intrusion whose magmas were sourced wholly from the melting of metamorphosed sediments (rather than igneous rocks). Because of both its young age and its evolved composition, this pluton has more in common with the Lake District and Northern Ireland granites than with those of Scotland, and it has been suggested that these areas shared a magma source.
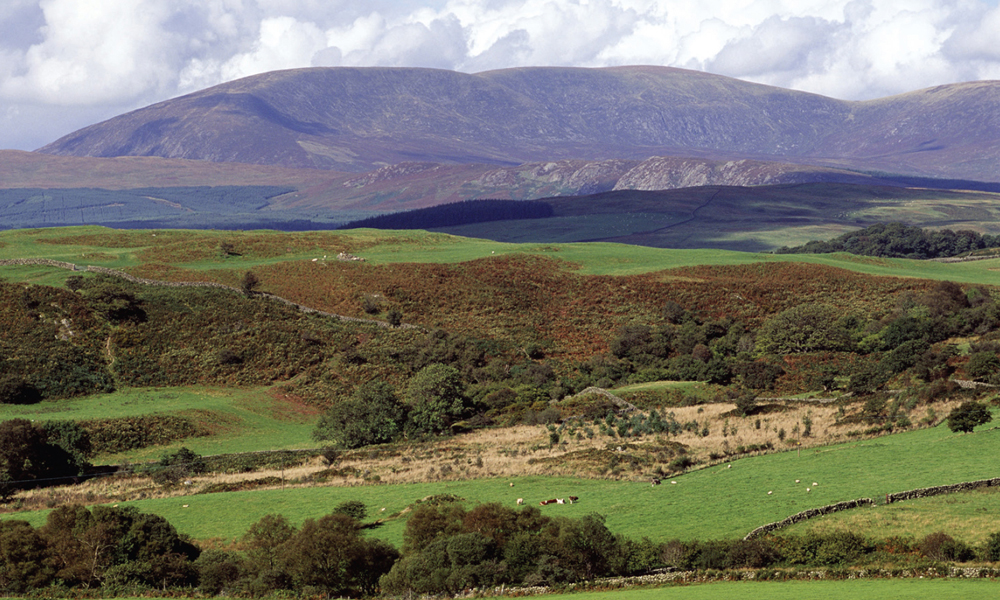
FIG 49. Cairnsmore of Fleet, 711 m (10 km east of Newton Stewart), viewed from the southeast. This mountain landscape has been created by erosion of the Fleet granite intrusion. (© Lorne Gill, Scottish Natural Heritage)
As these hot granite bodies were emplaced, their heat baked the surrounding rocks, creating an encircling metamorphosed zone (an aureole) 1 km or, in the case of the Criffel–Dalbeattie intrusion, even 2 km wide. These aureoles are often rich in mineral veins, deposited by hot circulating fluids released by the crystallising granite. Gold, silver, copper, lead and zinc are common, particularly around the Fleet intrusion, and over 60 copper and iron-rich carbonate veins have been located northwest of the Criffel–Dalbeattie pluton.
Volcanic vents active during the early Devonian are also present in the area, although they are generally poorly preserved. An exception is the large vent at Shoulder o’ Craig, 17 km southwest of Castle Douglas, on the Dee estuary. The headland here is principally made up of a vent-filling intrusion breccia, which consists of Silurian sandstone and siltstone clasts within a basalt (mafic) matrix. Both vent rock and country rock are cut by very potassium-rich dykes, indicating a magma source deep within the mantle. These dykes often have irregular shapes, and one dyke in the area is known as the ‘Loch Ness Monster’ due to its particularly bizarre outcrop pattern. On a regional scale, this area presents a bit of a conundrum, as volcanic vents, mantle-derived dykes and granite plutons, i.e. igneous rocks from all depths within the crust, were intruded around the same time (between around 415 and 400 million years ago, earliest Devonian), and are now seen at the same level of erosion.
Further north, the late Silurian and early Devonian was the time when a series of basins first began to develop in what would become the Midland Valley, as crustal tension caused movement on the Highland Boundary and Southern Uplands faults. At this time (around 420 to 400 million years ago), Scotland lay in the interior of a large continent some 20 degrees south of the equator, and in this environment the new Caledonian mountains were eroded rapidly because soil-binding plant cover had not yet evolved. Rivers and streams washed the sediment into the developing Midland Valley basins, forming coarse conglomerates, red sandstones and mudstones, collectively called the Lower Old Red Sandstone. Volcanic rocks (associated with crustal extension) are common in the upper 600 m of the Lower Old Red Sandstone, where lava sheets (predominantly andesite) are intercalated with river and lake sediments, mostly sandstones. Today, principal outcrops include a 400 m-thick lava pile underlying the Carrick Hills and a 600 m-thick lava pile in the Dalmellington area (20 and 30 km east of Girvan, respectively).
The Carrick Hills lava pile is particularly well exposed along the coast around Dunure (10 km southwest of Ayr). This coastal section has been studied for over a century in an attempt to unravel the complex relationships between the lava and intervening sediment; the upper and lower surfaces of andesite (mafic) sheets are often very irregular, with bulbous, finger-like protrusions that extend upwards and downwards into the sediment, or have become detached completely, forming zones of lava pillows. In places, lava engulfs patches of sediment; elsewhere, the lava is surrounded by sediment. The andesite sheets are generally well jointed, and these joints are often filled with hardened sandstone. Despite these contorted relationships, lamination in the sandstones is generally intact, save for a small zone near the contact. Such irregular contacts are thought to result from the sills being intruded into wet, unconsolidated sediment; as hot magma was emplaced, it vaporised water at the magma–sediment contact, fluidising the sediment in a narrow zone next to the contact. This vapour and its entrained sediment then flowed away along the hot contact surface, offering very little resistance to the magma and allowing bulbous protrusions to form. Likewise, the liquid magma could not push directly against the wet host sediment, and so this sediment remains largely undeformed, except at the contact zone. After intrusion, large amounts of water vapour were trapped in sediment enclaves and at contact zones. As the andesite then cooled, it contracted and cracked, often resulting in a sudden decrease of pressure in the sediment. This led to explosive boiling of the water, fluidising the sediment and blasting it along the fractures and cooling joints. Vesicles (cavities formed by gas bubbles) are also very common in the lavas, generally now infilled by minerals such as quartz, agate or chalcedony precipitated by circulating groundwaters.