Полная версия
Scotland

EDITORS
SARAH A. CORBET, ScD
PROF. RICHARD WEST, ScD, FRS, FGS
DAVID STREETER, MBE, FIBiol
JIM FLEGG, OBE, FIHort
PROF. JONATHAN SILVERTOWN
*
The aim of this series is to interest the general
reader in the wildlife of Britain by recapturing
the enquiring spirit of the old naturalists.
The editors believe that the natural pride of
the British public in the native flora and fauna,
to which must be added concern for their
conservation, is best fostered by maintaining
a high standard of accuracy combined with
clarity of exposition in presenting the results
of modern scientific research.
THE NEW NATURALIST LIBRARY
SCOTLAND
Looking at the Natural Landscapes
PETER FRIEND
with
LEAH JACKSON-BLAKE
and
JAMES SAMPLE


Contents
Cover
Title Page
Editors’ Preface
Authors’ Foreword and Acknowledgements
CHAPTER 1 - Looking at Scotland’s Landscapes
CHAPTER 2 - Surface Modifications
CHAPTER 3 - Movements of the Earth from Within
CHAPTER 4 - Episodes in the Bedrock History of Scotland
CHAPTER 5 - Later Surface Modifications
CHAPTER 6 - Area 1: Galloway
CHAPTER 7 - Area 2: Southern Borders
CHAPTER 8 - Area 3: Jura to Arran
CHAPTER 9 - Area 4: Glasgow
CHAPTER 10 - Area 5: Edinburgh
CHAPTER 11 - Area 6: Mull
CHAPTER 12 - Area 7: Rannoch
CHAPTER 13 - Area 8: Dundee
CHAPTER 14 - Area 9: Uists and Barra
CHAPTER 15 - Area 10: Skye
CHAPTER 16 - Area 11: Affric
CHAPTER 17 - Area 12: Cairngorm
CHAPTER 18 - Area 13: Aberdeen
CHAPTER 19 - Area 14: Lewis and Harris
CHAPTER 20 - Area 15: Cape Wrath
CHAPTER 21 - Area 16: Inverness
CHAPTER 22 - Area 17: Caithness
CHAPTER 23 - Area 18: Orkney
CHAPTER 24 - Area 19: Shetland
CHAPTER 25 - Overview
Further Reading
List of Searchable Terms
The New Naturalist Library
Copyright
About the Publisher
Editors’ Preface
IN HIS EARLIER NEW NATURALIST VOLUME on the natural landscapes of Southern England, the author, Peter Friend, presented a new vision of landscape, providing a geological background for our understanding of the distribution and variation of flora and fauna in the lowland parts of Britain.
A division of Britain into lowland and highland regions has often been made in descriptions of our flora and fauna, for example by Arthur Tansley in his classic book on Types of British Vegetation (1911). Now Peter Friend has turned his attention to Scotland, the major highland part of Britain. In contrast to the sedimentary origin of the ‘soft’ rocks of the lowlands, the ‘hard’ rocks of Scotland arise from a series of events in the Earth’s crust dating back to the earliest years of the planet, which were far less understood in the days when Dudley Stamp’s New Naturalist volume on Britain’s Structure and Scenery was published in 1946. The resulting structures, now much better understood, underlie Scotland’s great variations in rock type and altitudes. Allied to this is the effect of the northern climate on the distribution of plants and animals, making the Highlands an area of particular interest from the biogeographical point of view, a mountainous region in the far west of Europe, adjacent to the Atlantic.
The illustrations featured in this book take full account of the possibilities of aerial and satellite photography in analysing topography, showing the relation between the geology, the soils, and the directions and angles of sloping features – all factors which must affect flora and fauna. The arrangement into areas, each with a similar treatment and analysis of the landscape, makes the subject very accessible to those interested in the geology or visiting the areas, and to those studying the fauna and flora and wishing to understand the physical background of the natural history. This book is a welcome addition to the New Naturalist Library, and will strengthen our understanding of the important and basic relationships between geology and natural history.
Authors’ Foreword and Acknowledgements
THE PLEASURE OF ENJOYING A LANDSCAPE is greatly increased and deepened by developing some feeling for the events in the history of the Earth that may have caused it. This approach was followed in 2008, when Southern England, by Peter Friend, appeared as New Naturalist 108. The object was to provide a systematic general review of the landscapes visible in the countryside extending from Land’s End in the southwest to East Anglia in the east. Peter has now been joined by two others, Leah Jackson-Blake and James Sample, to apply a similar approach to Scotland.
Peter and his two brothers were brought up in Edinburgh, in the Midland Valley of Scotland, moving with the family for a few years to Peebles in the Southern Uplands, during part of the Second World War. Many of the family activities involved visits to the countryside, and the pleasures and interests of these visits have continued into new generations of the family. The other two authors of this book have recently moved from southern England, where the book has been written, and now enjoy the landscapes of northern Scotland where they live and work.
Landscapes are easy to look at, given reasonable weather conditions, but difficult to describe in words. But developments in computer technology now offer many ways of analysing landscapes using different mapping methods, and these, along with diagrams and photos, form the framework of this book. Working on this imagery has been the main contribution of a succession of enthusiastic helpers. Lucinda Edes, Emilie Galley and Liesbeth Renders, and the second and third authors of this book, have all contributed great skill and enthusiastic innovation to this work, and made the project enjoyable as well as successful.
The home of this project has been the Department of Earth Sciences in the University of Cambridge. Peter Friend walked into the department as a first-year student some 57 years ago, to meet his supervisor, W. Brian Harland, for the first time. Apart from a period in the Scott Polar Research Institute, he has been based in Cambridge Department of Earth Sciences ever since, teaching and exploring the scenery and geology of many parts of the world. This work has included many visits to Spitsbergen (under the guidance of W. Brian Harland), Greenland, Spain, the Arabian Gulf, India and Pakistan. This has been an exciting period to be working in geology in Cambridge, because many key advances in the subject have been made by people working in Cambridge. CASP, originally the Cambridge Arctic Shelf Programme, made a valuable donation in support of the aerial photography used in this book.
All three authors would like to acknowledge their debts to the Cambridge college system. In the case of Peter Friend, his college, Darwin, has provided him with the congenial friendship of many people from diverse backgrounds, and their skills have helped him to remain a generalist in his interests.
Any work of this sort on the British Isles owes a fundamental debt to the British Geological Survey (BGS), now based at Keyworth near Nottingham. The numerous Survey maps and reports provide a remarkable source of carefully observed and objective information. The BGS has readily provided advice and help for this project, and helped to determine the sort of coverage and level that would be best.
The photographs that form such an important part of this book have come from many sources, and we are grateful to the following organisations and individuals for allowing us to use the results of their work (individually credited in the figure captions): Aerographica (Patricia and Angus Macdonald), Nicholas Branson, British Geological Survey, Lorne Gill, Last Refuge Limited (the late Adrian Warren, and Dae Sasitorn), David Law, Planetary Visions/Science Photo Library, Scottish Natural Heritage, Nigel Trewin.
Many other people have made important contributions by providing ideas and materials. These include John R. L. Allen, Wendy Annan, Phillip Gibbard, Alan Smith, Nigel Trewin, Nigel Woodcock and Richard West.
As with the New Naturalist volume on Southern England, this volume is dedicated to the Dr John C. Taylor Foundation, which has provided the financial support essential for the production of the imagery that is such a key part of the book’s presentation. Some 50 years ago, John spent two summers exploring the geology of Spitsbergen with Peter Friend, and the support of his foundation has made both books possible.
We wish to thank HarperCollins Publishers for their support of the New Naturalist series, and particularly Myles Archibald, and then Julia Koppitz, for enthusiasm and help throughout. Hugh Brazier, Martin Brown and Robert Gillmor have brought great talents to different aspects of preparing this book.
The cover shows a view at Siccar Point, Berwickshire (Area 5). When James Hutton and some friends visited in 1788, they recognised what is now known to be an unusally good example of an unconformity. They made geological history by seeing it as evidence of the folding, erosion and deposition of strata over an incredibly long series of episodes in the Earth’s past history (see also picture).
CHAPTER 1
Looking at Scotland’s Landscapes
LANDSCAPES AND LANDFORMS
FIGURE 1 IS A SCOTTISH VIEW, showing landscapes that are typical of the confections of topographic shapes, sea, light, colour and atmosphere that are enjoyed by all. The object of this book is to contribute further to that enjoyment by surveying the varied landscapes of Scotland, and to help the reader to discover the stories that lie behind the rich variety.
At least two landscapes are present in this photograph: (1) in the middle distance, terraced hills in autumn gold vegetation extend down to the shores of Loch Slapin in the foreground, about 2 km in coastal length, and (2) behind this landscape rises the dark mass of the Cuillin mountains, providing one of the most famous and distinctive of Scottish landscapes, covering an area some 10 km across and giving a skyline to this photograph that is about 15 km from the photographer.
Many enthusiasts have written about the scenery of specific parts of Scotland. In this book the aim has been to cover the whole country relatively uniformly, because the variations from place to place are interesting in themselves. But this uniformity of approach has made it necessary to adopt a rather broad-brush treatment, whilst establishing the linear scale of features by the use of maps and aerial photographs in which the scale is clear in general terms. It is useful to follow earlier authors who regarded a landscape as an area of land that can be seen from one vantage point. In the case of Figure 1, the oblique aerial view covers two landscapes that are kilometres to tens of kilometres across.
Figure 1 provides a fine example of Scottish scenery that not only allows some questions of scale to be considered, but also illustrates the sorts of features that can be used to investigate the stories behind landscapes. Numerous small cliffs and bays of the coastal cliffs are visible in the foreground, where resistant bedrock provides information about the early history of events in this landscape area. The Cuillin mountains themselves are very special in the amount of bedrock that is visible in their slopes, and in the roughness that this bedrock has given to the peaks and ridges. As we shall see, the bedrock history of the Cuillin provides an explanation of the size and surface style of these remarkable hills. In the middle distance, various smaller landscape features, landforms, are visible, particularly some clearly developed terraces and cliffs. There are also smaller ridges, cross-cutting the terraces and cliffs, and often occupied by small stream valleys. These landforms directly reflect erosion of different features of the bedrock. The middle distance also illustrates the way that the gentler slopes tend to have a covering of surface blanket, often made of peat, soil or relatively weak and young sediment.
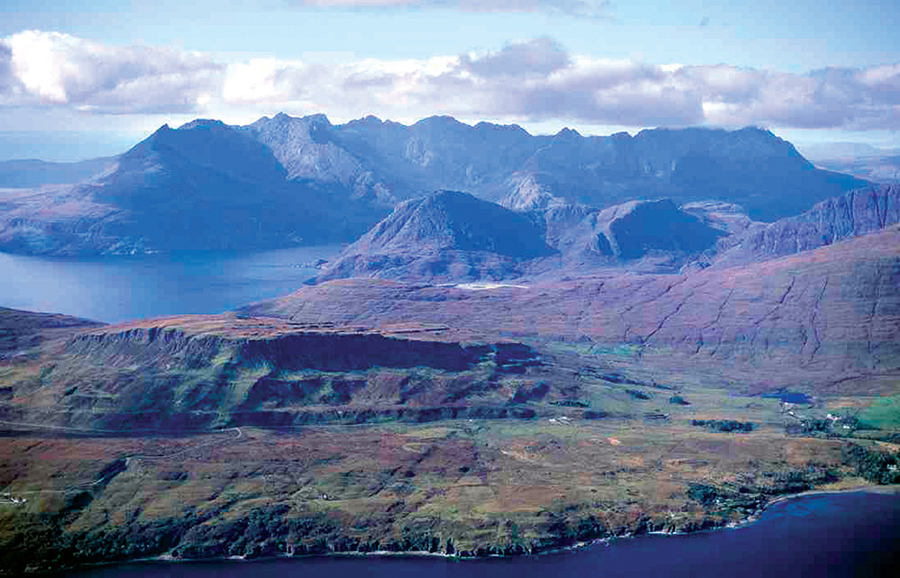
FIG 1. Aerial oblique photograph looking northwestwards towards the Cuillin mountains, Skye. (© Patricia & Angus Macdonald/Aerographica)
PEOPLE
Much has been written about landscape history, and by many people the phrase tends to have been used for the way that mankind has modified landscapes. This approach is not the main focus of this book, which deliberately concentrates on natural landscape features. However, all the landscapes described contain roads and settlements. In some cases, such as in Figure 1, these are visible but have had little impact on the landscape as a whole. In other Scottish cases, landscapes have been changed profoundly by the building works of man, and the city and town landscapes of the Midland Valley are obvious examples (Fig. 2). In other cases, subtle changes of landscape vegetation across Scotland may well be the result of man’s arrival and growing influence.
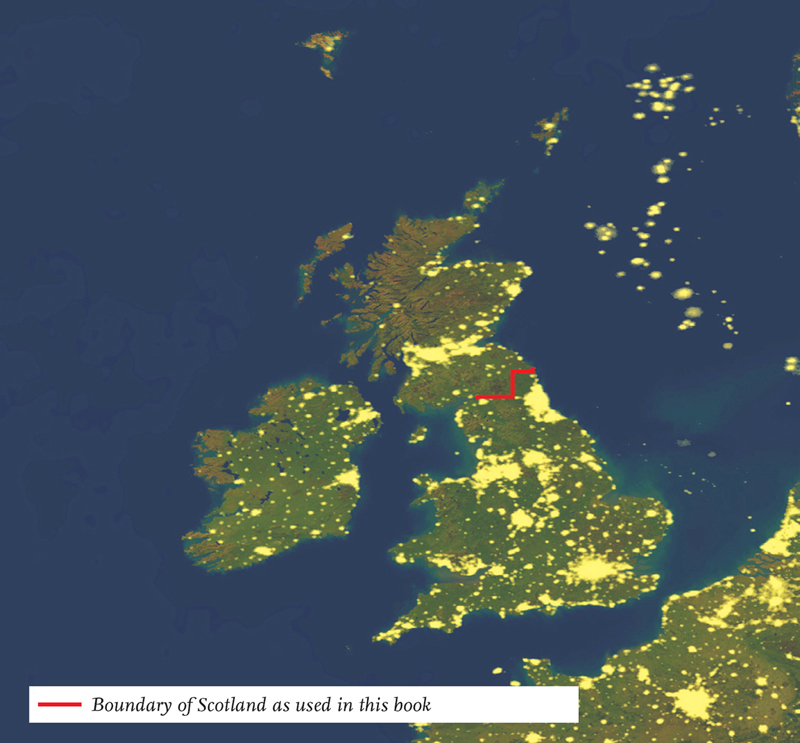
FIG 2. Satellite image covering the British Isles, showing population centres (including the Midland Valley of Scotland) picked out by man-made lighting at night. Note also the lighting on oil and gas platforms in the North Sea. (© Planetary Visions Ltd/Science Photo Library)
AREAS AND MAPS
The systematic survey of Scotland is based on a division into a grid of 19 arbitrary Areas (Fig. 3). Each Area is based loosely on the pattern of double-page areas used in the larger road atlases available, in particular the Collins Road Atlas, Britain. The object is to provide total coverage of the land areas and islands of Scotland, allowing the reader to navigate easily from place to place. At the beginning of each Area chapter, a location map explains the relationship between the Area and its neighbours. Ordnance Survey (OS) National Grid references are provided for the edges of the Area, in kilometres east and north of the arbitrary National Grid origin some 80 km west of the Isles of Scilly, southwest England.
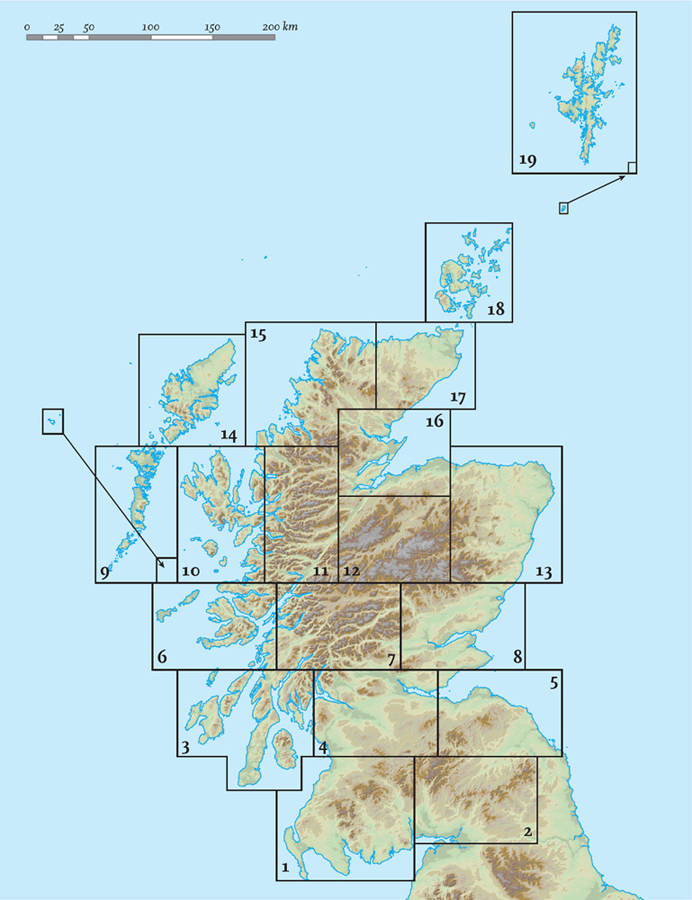
FIG 3. Division of Scotland into 19 Areas.
The sizes and shapes of the Areas have been adjusted to fit the shape of the land areas concerned: these Areas range from 50 to 100 km wide (from west to east) and 70 to 130 km high (from south to north), covering the shape and form of the mainland and islands of Scotland. On average each Area is about 100 × 100 km. All Areas are defined by National Grid south to north and west to east lines, and except for a few oblique view maps, all our maps use the same boundary orientation so that Grid North is parallel to the up-and-down margins.
Shaded, colour-coded maps are used to convey the height and approximate shape of the land surface in each Area. These maps have been produced from data collected by the space shuttle Endeavour in February 2000 as part of NASA’s Shuttle Radar Topographic Mission (SRTM). This 11-day mission used stereo pairs of radar images to build up a Digital Elevation Model (DEM) covering nearly 80 per cent of the Earth’s surface. The original dataset used in this book is publicly available via the SRTM website (www2.jpl.nasa.gov/srtm) and consists of pixels, approximately 90 × 90 m, each of which has an associated elevation value. The absolute vertical accuracy of these data is estimated to be ± 16 m, whilst the absolute horizontal accuracy is ± 20 m.
Data on roads, railways, coastlines, town boundaries, rivers etc., suitable for reproduction at a scale of 1 : 200,000, have been made available by the Collins Bartholomew mapping agency. For further detail it is recommended that the Ordnance Survey Landranger (1 : 50,000) maps are used.
We have used ESRI ARC Geographic Information System (GIS) software in the processing and manipulating of the map data. This software makes it possible to present maps with artificial hill-shading, so that topography becomes easier to visualise. Maps presenting the directions and slope angles of sloping features are also very useful in some situations.
Many of the maps make use of a standard colour scheme, ranging from greens for the lowest ground through yellows to browns and greys for the highest ground. In general, the full range of colours has been used for each map, no matter what numerical range of heights is involved. This makes it possible to convey the fine detail of slopes and other features, whether the map covers flat ground or valleys and high peaks. To make it possible to compare between maps using this colour sequence, we have quoted the maximum elevation reached in each Area.
CHAPTER 2
Surface Modifications
THE LANDSCAPE CYCLE
IN CHAPTER 1, WE ILLUSTRATED our use of the word landscape to indicate an area a few kilometres to many kilometres across that is distinctive in appearance and origin. We have also found the word landform useful for smaller features of landscapes formed by distinctive surface processes during the modification of the landscape surface. In this chapter, we shall be examining further some aspects of certain of these landforms.
Our developing understanding of the larger workings of the Earth has shown us that although surface modifications are almost always apparent, the Earth’s crust and its surface have been subject to continual movements generated within the Earth. Earthquakes and volcanoes are obvious signs of these internal movements. Any landscape is the result of the interplay between these contrasting internal and external systems, as illustrated using the cycle diagrams (Figs 4, 5). These illustrate the two systems in usefully different ways.
DIGITAL MAPS, SLOPES AND DOWNSLOPE MOVEMENT
We explained in Chapter 1 that our primary information about the shapes and patterns of Scottish landscapes comes from the use of the digital elevation datasets that are now available. Most people are familiar with the representation of elevation information on maps, using colour shading, or contours representing lines of specified elevation on the surfaces. The GIS software that we have used is a powerful tool for presenting topography in these ways. The same software makes it possible to represent topography using a hill-shade approach, which portrays topography using a shadowing effect, as estimated by an artificial light source with a specific orientation and elevation angle. The effects can appear similar to those produced by hachuring, as used in early Ordnance Survey maps, although hachure shading owed much to the eye of the individual draughtsman.
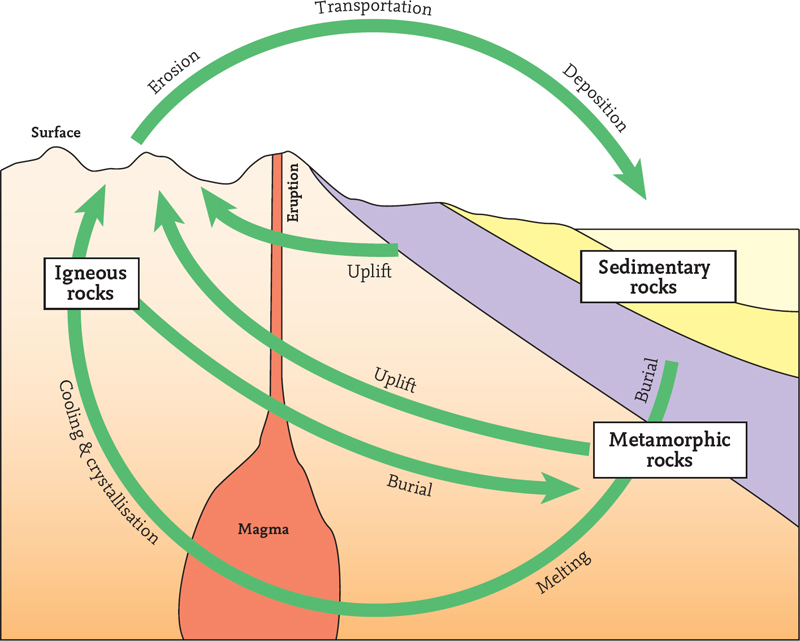
FIG 4. Diagram illustrating the processes of movement occurring within the outer layers of the Earth’s crust, and how these relate to the processes and features of the Earth’s surface and atmosphere.
As outlined in Chapter 1, our maps of Scotland are based on digital elevation data where areas are divided into large numbers of small square unit areas (pixels), arranged in a rectangular grid. The elevation above sea level of each of the pixels is recorded in the database, and much of our data are based on a pixel size of 90 × 90 m. Although this resolution is adequate to provide information on larger landforms, we have to accept that many smaller landforms will be invisible if the pixel size is similar in area to, or larger than, the landform.
Digital elevation data can be directly represented on a map using colour shading or contours. It is also possible to define slopes by measuring changes of elevation within clusters of neighbouring pixels, allowing each pixel to be assigned a local slope value and converting the simple grid of elevation measurements into a grid of differences in elevation, or slopes. These maps are sometimes referred to as ‘first derivative’ maps of the topography, because they represent changes of topography (local slopes) rather than the elevations themselves. Whatever the limitations of scale, there is no question that examining patterns of slope variation is a powerful way of studying the shapes of landscapes, and the Area chapters that follow make frequent use of maps of this sort.
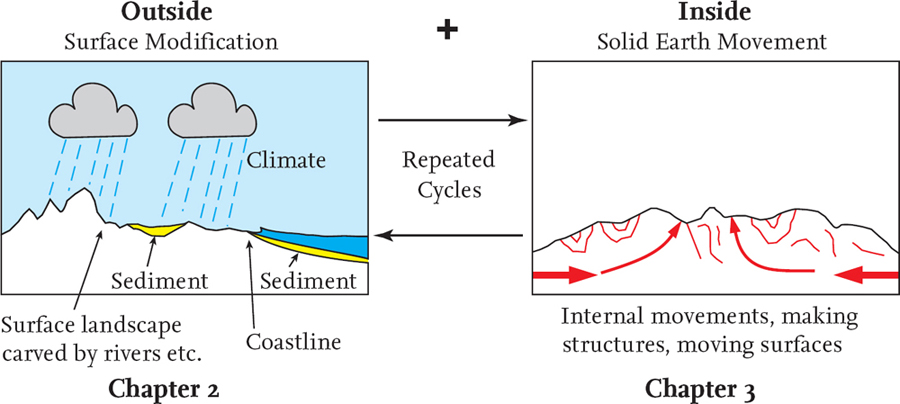
FIG 5. Landscapes are changed by surface modifications (Chapter 2) and solid Earth movements (Chapter 3).
We now consider the sorts of processes that are likely to give rise to various different features and patterns of slopes through time.
Slopes are likely to have a direct and profound influence on the way topography evolves through time, because any slope surface has the potential for downslope movement under gravity (Fig. 6). Movement will often require triggering, for example by earthquakes, freeze–thaw ice changes or even heavy rainfall.
Even more important in determining the amount of movement and the angle of slope that can occur is the nature of the materials making the slope. Bedrock of igneous or metamorphic origin, consisting mainly of coarse crystals of interlocking minerals, formed at high temperatures in the Earth, such as quartz, feldspar and other silicate minerals, is likely to produce a strong material in terms of its surface weathering behaviour. At the other extreme, certain sedimentary rocks, consisting of small particles of clay minerals separated from their neighbours by films of water, will be weak and strongly liable to downslope mass flow, tending to produce a distinctly lower slope angle.
RIVER CATCHMENTS AND VALLEY PROCESSES
Looking back at the landscapes from Skye (Fig. 1), and excluding coastline considerations for the moment, the first step in analysing landscape shape or morphology, as just discussed, is to realise that most of the detailed features visible can be considered as combinations of different scales and combinations of slopes. Our survey of Scotland has confirmed for us that, under present-day climate conditions, rivers and streams are the fundamental agents forming and changing valleys and slopes. This is why we have designed our computer-based maps to display clearly the locations and shapes of these landforms.
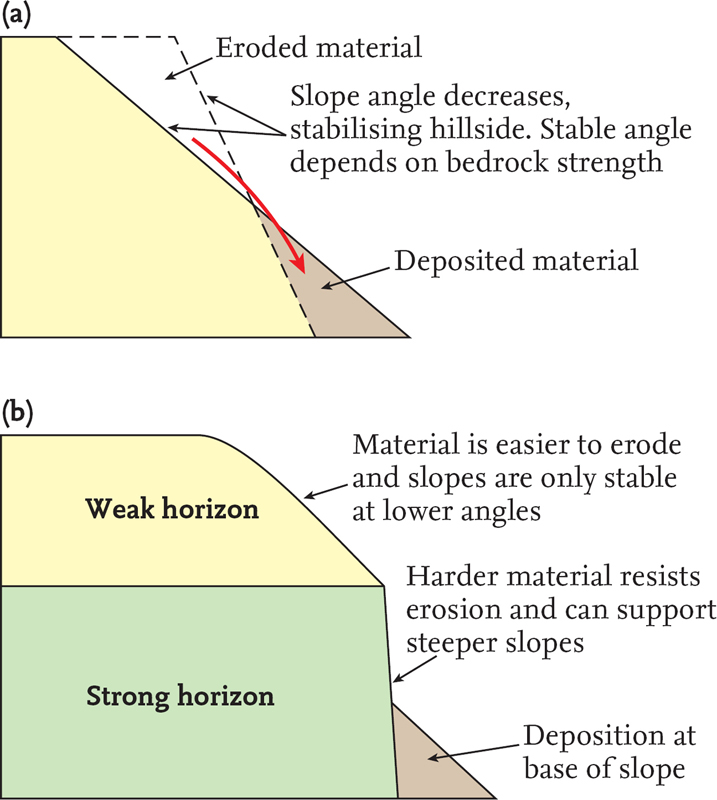
FIG 6. Models of downslope movement: (a) uniform material and movement; (b) non-uniform material and non-uniform movement (greatest from upper slope).
We can demonstrate the widespread importance of these river-generated landforms by plotting the pattern of large river catchments across present-day Scotland (Fig. 7). This map further supports the claim that these river and stream agents are easily the most important agents in the modification by erosion of Scotland and its landscapes. This map has been compiled using data from the Scottish National River Flow Archive collected by the Environment Protection Agency. The areas of the larger river catchments are superimposed on an elevation-shaded map of most of Scotland. In the interests of clarity, only the larger catchments are shown, leaving clear a zone of land, up to some 40 km wide, around the coast and including the islands, where the catchments are smaller.