Полная версия
Southern England
Not only can these frozen ground processes be studied in Arctic areas today, but they have left characteristic traces in many of the landscapes of Southern England. Some examples from Norfolk are illustrated in Chapter 8 (Figs 306 and 307), and these provide specific examples of the result of ancient freeze-thaw processes on a small scale. However, the more we examine the wider features of present-day landscapes across Southern England, the more it becomes clear that most have been considerably modified by the general operation of frozen ground processes during the last 2 million years. These processes are likely to have been responsible for the retreat of significant slopes and even for the lowering of surfaces that have almost no perceptible slope.
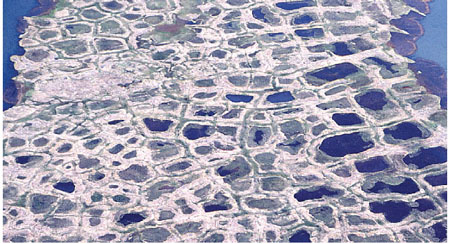
FIG 17. Polygonal frozen ground patterns on the Arctic coastal plain near Barrow, Alaska. (Copyright Landform Slides – Ken Gardner)
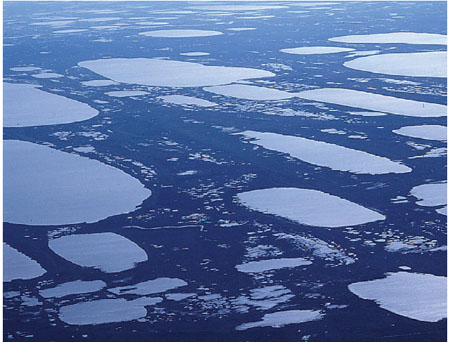
FIG 18. Thaw lakes, the larger ones several kilometres long, on the Arctic coastal plain near Barrow, Alaska. (Copyright Landform Slides – Ken Gardner)
THE LAST 30,000 YEARS TIMESCALE AND RECENT MODIFICATION
The timescale shown in Figure 19 covers a period during which various episodes have changed the landscapes of Southern England, creating our present-day world. These episodes include the dramatic rise in sea level and landward movement of the coastline caused by the warming of the climate following the last cold episode of the Ice Age. They also include the progressive changing of the countryside by people, leading up to the domination of some landscapes by man-made features.
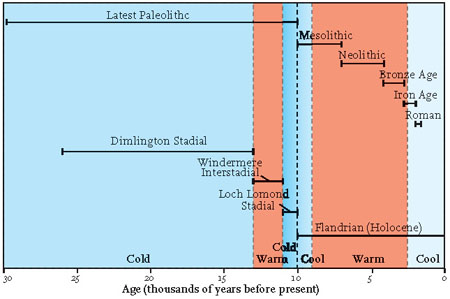
FIG 19. Time divisions for the last 30,000 years (Late Pleistocene to Holocene).
Time Division Years Before Present Windermere Interstadial 13,000–11,000 Loch Lomond Stadial 11,000–10,000 Flandrian (Holocene) 10,000-present Mesolithic 11,000–7,000 Neolithic 7,000–4,150 Bronze Age 4,150–2,750 Iron Age 2,750–1,950 Roman 1,950–1,600The last 30,000 years have been warm, on average, relative to the previous 2 million years of the Ice Age. However, the higher level of detail available in this timescale makes it clear that climate change has not been one of uniform warming during this period. Short periods of colder climate, temporarily involving ice-sheet growth in the north of Britain (sometimes called stadials) have alternated with short periods of warmer climate (referred to as interstadials).
SEA-LEVEL CHANGE
The coastline is the most recently created part of the landscape, and the most changeable. This is due, in large part, to the rise in sea level over the last 20,000 years, since the last main cold episode of the Ice Age (the Devensian). Twenty thousand years ago sea level was 120 m lower than it is today because of the great volumes of water that were locked away on land in the world’s ice sheets (Fig. 20). Land extended tens or hundreds of kilometres beyond the present-day coastline, and Southern England was linked to northern France by a large area of land (Fig. 21). Global climate started to warm about 18,000 years ago (Fig. 13) and the world’s ice started to melt, raising global sea level. The North Sea and the Channel gradually flooded, and Britain became an island between 10,500 and 10,000 years ago. This flooding by the sea is known as the Flandrian transgression and was a worldwide episode.
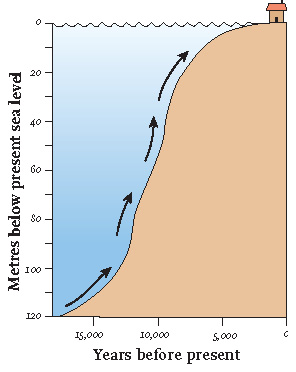
FIG 20. Graph of sea-level rise over the last 18,000 years.
During the period of most rapid sea-level rise (between 12,000 and 8,000 years ago), areas of low-lying land were swamped and some local features of the coastal scenery moved great distances geographically towards their present positions. The sea cliffs, beach barriers, salt marshes, spits and estuaries that can be seen today have only taken up their present positions over the last few thousand years, as sea-level rise slowed.
In the treatment of the Regions and Areas in the rest of this book, maps are presented that distinguish a coastal flooding zone. This presentation is based on the simplifying assumption that the solid Earth movement of Southern England (i.e. any uplift or subsidence, see Chapter 3) has been very small compared with global sea-level changes. The coastal flooding zone is defined as extending between the submarine contour 120 m below present sea level and the contour 20 m above present sea level, and it can be used to identify parts of landscapes which are likely to have been areas of coastline activity in the recent past. Areas of land with an elevation between present sea level and 120 m below sea level correspond to the land submerged during the last 18,000 years of sea-level rise. Areas lying at, or up to, 20 m above present sea level may have been subjected to coastal processes during the highest sea levels of earlier interglacial periods, such as the Ipswichian (see Fig. 13). The coastal flooding zone also defines areas of land that are most likely to become submerged during predicted future rises of sea level.
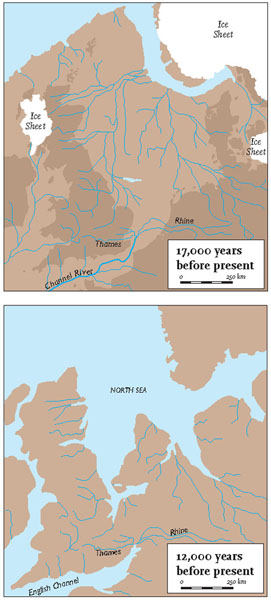
FIG 21. Two episodes (17,000 and 12,000 years ago) in the rise of sea level around the North Sea area. (Redrawn and simplified from Current Archaeology 207, 2006, Gaffney)
Drowned valleys (Figs 22 and 23) are present on the coastlines of Southern England as a result of recent sea-level rise. Formerly, the rivers draining the majority of these valleys would have transported mud and sand to the sea, where it would have been deposited on the sea bed. However, with the rise in sea level mud and sand are now often deposited in the flooded valleys or estuaries instead, and some have developed carpets of sediment, transported down-valley by rivers or brought up-valley by the sea where tides and storms have been effective.
Coastlines with low seaward slopes and a soft surface blanket and/or bedrock may develop beach barriers when flooded by rising sea level. These barriers are ridges of sand or gravel parallel to the general trend of the coastline (Fig. 24). They are created by the impact of storm waves on the gently sloping and soft landscape. They tend to develop a cap of wind-blown sand which is very vulnerable to storm wave erosion, but may eventually become stabilised by vegetation. Behind the barrier a low-lying area of more sheltered conditions develops and regular flooding at high tide may bring in muddy sediment from the sea that can settle and build up salt marshes.
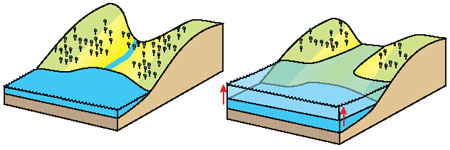
FIG 22. The drowning of a valley by sea-level rise.
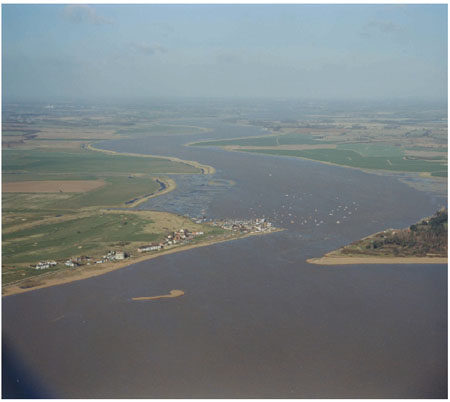
FIG 23. Drowned valley of the Deben, Suffolk, viewed from above the sea off Felixstowe Ferry. (Copyright London Aerial Photo Library)
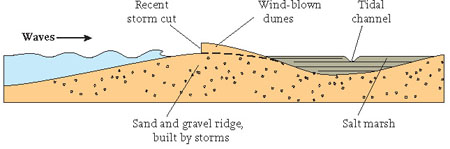
FIG 24. Cross-section of a beach barrier formed as sea level rises over a very gently sloping landscape.

FIG 25. Beach barrier on Scolt Head Island, Norfolk. (Photograph held at Cambridge University Collection of Air Photographs, Unit for Landscape Modelling)
The aerial photograph of part of Scolt Head Island (Fig. 25) in north Norfolk shows the succession of zones parallel to the coastline typical of a recently flooded, gently sloping landscape. On the beach, coast-parallel ridges and hollows (runnels) have been created during recent storms, and are draining water as the photograph was taken at low tide. The crest of the barrier is capped by wind-blown dunes, which have been stabilised by marram grass, but also shows signs of erosion during recent storms. Behind the barrier are salt marshes, generally sheltered from storm waves and developing tidal channels. The salt marshes are forming around the remains of various sand and gravel spits that date from a landscape before the present beach barrier was there. The far side of the salt marsh is marked by a gently curved sea wall built within the last two centuries to reclaim some land by keeping high tides out. Behind that is the boundary between the present flat seaward zone of young sediment and the older terrain, marked by a complex field pattern that is underlain by Chalk bedrock.
DEVELOPMENT BY PEOPLE
My concern in this book is primarily with natural landscapes, and I will tend to comment on the development by people since the Bronze Age only where this relates to the natural features in an interesting way. However, in reviewing the appearance of the whole of Southern England, I have been struck by an intriguing distinction made by some landscape historians: the distinction between ancient and planned countryside (Figs 26–28). I have based my approach on the discussions offered by Oliver Rackham, ecologist and landscape historian, and these are summarised below.
Ancient countryside (Fig. 26) consists of many hamlets, small towns, ancient farms and hedges (of mixed varieties of shrubs and trees), along with roads that are not straight, numerous footpaths and many antiquities.
Planned countryside (Fig. 27) has distinct villages, much larger than the hamlets, along with larger eighteenth- and nineteenth-century farms, hedges of hawthorn and straight roads. Footpaths are less common and the few antiquities that are present are generally prehistoric.
I have re-examined the same areas used by Oliver Rackham as examples of these two countryside types, and compared the early Ordnance Survey maps with maps of the same area generated by me using the data and methods used in this book (see Chapter 1). The shading and ‘hachured’ patterning used in the earlier maps represents the hills and slopes rather clearly – better than the contour representation used in the present-day Ordnance Survey Landranger maps, although these show man-made features much more clearly. My map representation is a compromise in that it represents elevations and slopes using colours and hill-shading, but also allows the patterns of roads and settlements to be seen.
Oliver Rackham’s conclusion is that many of the distinctive features of planned countryside were created by the general parliamentary enclosure of land during the eighteenth and nineteenth centuries. This involved the wholesale conversion of commonly held land with open fields into enclosed fields awarded to individuals and institutions. Many landscape historians have claimed earlier origins for the difference between ancient and planned countryside, believing that historical and cultural differences in the people who settled and developed the two areas played an important role. Variations in the bedrock geology also seem to be important here. For example, the ancient countryside shown in Figure 26 is underlain by strongly deformed Variscan bedrock that has been eroded into small hills and valleys (see Chapter 4).
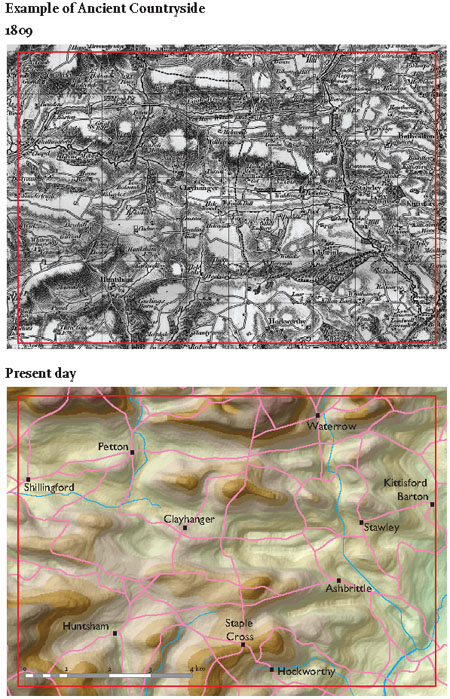
FIG 26. Example of ancient countryside at the Devon-Somerset border, near Tiverton, with 1809 and recent mapping compared. (Upper part from Cassini Old Series map 181, copyright Cassini Publishing 2007/www.cassinimaps.co.uk)
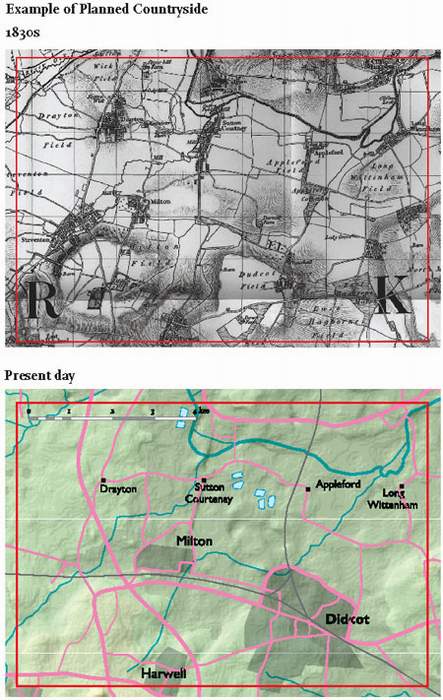
FIG 27. Example of planned countryside at the Berkshire-Oxfordshire border, around Didcot, with 1830s and recent mapping compared. (Upper part taken from Cassini Old Series maps 164 and 174, copyright Cassini Publishing 2007/www.cassinimaps.co.uk)
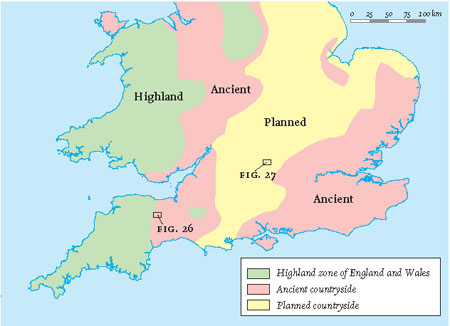
FIG 28. Generalised map distinguishing ancient and planned countryside across Southern England.
In contrast, the planned countryside covered by Figure 27 consists of only gently tilted Mesozoic bedrock that has formed a much flatter and more open landscape.
CHAPTER 3 Movement of the Earth’s Surface from Within
WIDESPREAD MOVEMENTS OF THE EARTH’S SURFACE
TO UNDERSTAND THE CHANGES and movements affecting the appearance of the landscape on large scales we need to review some geological systems, especially plate tectonics. Many of the large changes that have created landscapes over long periods of time can now be understood using this discovery.
Knowledge of the processes causing the movement of large (10–1,000 km length-scale) areas of the Earth’s surface has been revolutionised by scientific advances made over the last 40 years. During this time, scientists have become convinced that the whole of the Earth’s surface consists of a pattern of interlocking tectonic plates (Fig. 29). The word ‘tectonic’ refers to processes that have built features of the Earth’s crust (Greek: tektōn, a builder). The worldwide plate pattern is confusing – particularly when seen on a flat map – and it is easier to visualise the plates in terms of an interlocking arrangement of panels on the Earth’s spherical surface, broadly like the panels forming the skin of a football.
Tectonic plates are features of the lithosphere, the name given to the ≈125 km thick outer shell of the Earth, distinguished from the material below by the strength of its materials (Greek: lithos, stone). The strength depends upon the composition of the material and also upon its temperature and pressure, both of which tend to increase with depth below the Earth’s surface. In contrast to the mechanically strong lithosphere, the underlying material is weaker and known as the asthenosphere (Greek: asthenos, no-strength). Note that on figure 30 the crustal and outer mantle layers are shown with exaggerated thickness, so that they are visible.
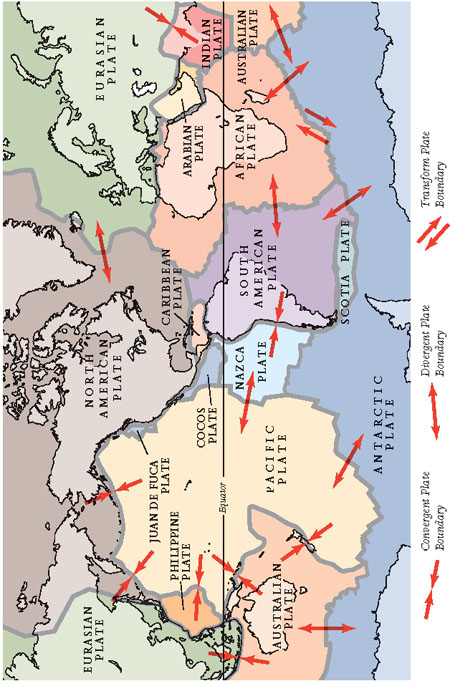
FIG 29. World map showing the present pattern of the largest lithosphere plates.
Most of the strength difference between the lithosphere and the asthenosphere depends on the temperature difference between them. The lithosphere plates are cooler than the underlying material, so they behave in a more rigid way when subjected to the forces generated within the Earth. The asthenosphere is hotter and behaves in a more plastic way, capable of deforming without fracturing and, to some extent, of ‘flowing’. Because of this difference in mechanical properties and the complex internal forces present, the lithosphere plates can move relative to the material below. To visualise the motion of the plates, we can use the idea of lithospheric plates floating on top of the asthenosphere.
Looking at the surface of the Earth (Fig. 29), the largest plates show up as relatively rigid areas of the lithosphere, with interiors that do not experience as much disturbance as their edges. Plates move relative to each other along plate boundaries, in various ways that will be described below. The plate patterns have been worked out by investigating distinctive markers within the plates and at their edges, allowing the relative rates of movement between neighbouring plates to be calculated. These rates are very slow, rarely exceeding a few centimetres per year, but over the millions of years of geological time they can account for thousands of kilometres of relative movement.
It has proved to be much easier to measure plate movements than to work out what has been causing them. However, the general belief today is that the plates move in response to a number of different forces. Heat-driven circulation (convection) occurs within the mantle, but other forces are also at play. Where plates diverge, warm, new material is formed that is elevated above the rest of the plate, providing a pushing force to move the plate laterally, around the surface of the Earth. At convergent boundaries, cold, older material ‘sinks’ into the asthenosphere, providing a pulling force which drags the rest of the plate along behind it. Deep within the Earth, the sinking material melts and is ultimately recycled and brought back to the surface to continue the process.
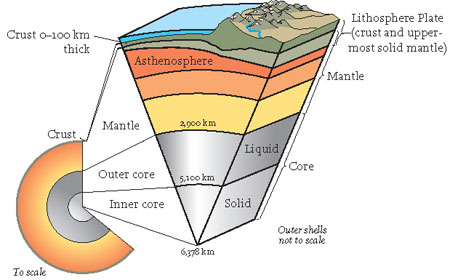
FIG 30. Diagram of the internal structure of the Earth.
Knowledge of how tectonic plates interact provides the key to understanding the movement history of the Earth’s crust. However, most people are much more familiar with the geographical patterns of land and sea, which do not coincide with the distribution of tectonic plates. From the point of view of landscapes and scenery, coastlines are always going to be key features because they define the limits of the land; we make no attempt in this book to consider submarine scenery in detail.
The upper part of the lithosphere is called the crust. Whereas the distinction between the lithosphere and the asthenosphere is based upon mechanical properties related to temperature and pressure (see above), the distinction between the crust and the lower part of the lithosphere is based upon composition. Broadly speaking, there are two types of crust that can form the upper part of the lithosphere: continental and oceanic. An individual tectonic plate may include just one or both kinds of crust.
Continental crust underlies land areas and also many of the areas covered by shallow seas. Geophysical work shows that this crust is typically about 35 km thick, but may be 80–90 km thick below some high plateaus and mountain ranges. The highest mountains in Britain are barely noticeable on a scale diagram comparing crustal thicknesses (Fig. 31). Continental crust is made of rather less dense materials than the oceanic crust or the mantle, and this lightness is the reason why land surfaces and shallow sea floors are elevated compared to the deep oceans. Much of the continental crust is very old (up to 3–4 billion years), having formed early in the Earth’s life when lighter material separated from denser materials within the Earth and rose to the surface.
Oceanic crust forms the floors of the deep oceans, typically 4 or 5 km below sea level. It is generally 5–10 km thick and is distinctly denser than continental crust. Oceanic crust only forms land where volcanic material has been supplied to it in great quantity (as in the case of Iceland), or where other important local forces in the crust have caused it to rise (as is the case in parts of Cyprus). Oceanic crust is generally relatively young (only 0–200 million years old), because its higher density and lower elevation ensures that it is generally subducted and destroyed at plate boundaries that are convergent (see below).
Figure 29 shows the major pattern of tectonic plates on the Earth today. The Mercator projection of this map distorts shapes, particularly in polar regions, but we can see that there are seven very large plates, identified by the main landmasses located on their surfaces. The Pacific plate lacks continental crust entirely, whereas the other six main plates each contain a large continent (Eurasia, North America, Australia, South America, Africa and Antarctica) as well as oceanic crust. There are a number of other middle-sized plates (e.g. Arabia and India) and large numbers of micro-plates, not shown on the world map.
Figures 29 and 32 also identify the different types of plate boundary, which are distinguished according to the relative motion between the two plates. Convergent plate boundaries involve movement of the plates from each side towards the suture (or central zone) of the boundary. Because the plates are moving towards each other, they become squashed together in the boundary zone. Sometimes one plate is pushed below the other in a process called subduction, which often results in a deep ocean trench and a zone of mountains and/or volcanoes, as well as earthquake activity (Fig. 32). The earthquake that happened on the morning of 26 December 2004 under the sea off western Sumatra was the strongest anywhere in the world for some 40 years. It seized world attention particularly because of the horrifying loss of life caused by the tsunami waves that it generated. This earthquake was the result of a sudden lithosphere movement of several metres on a fault in the convergent subduction zone where the Australian plate has been repeatedly moving below the Eurasian plate.
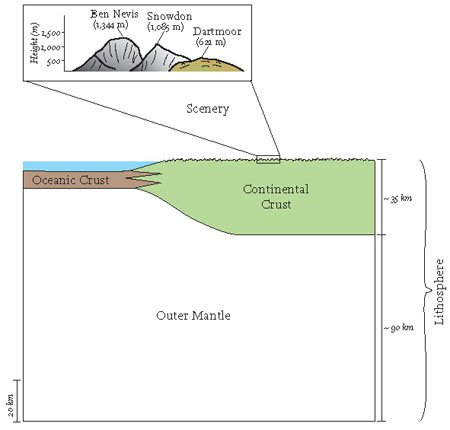
FIG 31. Scale diagram comparing average thicknesses of oceanic and continental crust and lithosphere.
In other cases the plate boundary is divergent, where the neighbouring plates move apart and new material from deeper within the Earth rises to fill the space created. The new oceanic crust is created by the arrival and cooling of hot volcanic material from below. The mid-Atlantic ridge running through Iceland, with earthquakes and volcanic activity, is one of the nearest examples to Britain of this sort of plate boundary.
Other plate boundaries mainly involve movement parallel to the plate edges and are sometimes called transform boundaries. The Californian coast zone is the classic example but there are many others, such as the transform boundary between the African and Antarctic plates. In some areas, plate movement is at an oblique angle to the suture and there are components of divergence or convergence as well as movement parallel to the boundary.
Britain today sits in the stable interior of the western Eurasian plate, almost equidistant from the divergent mid-Atlantic ridge boundary to the west and the complex convergent boundary to the south where Spain and northwest Africa are colliding. In its earlier history the crust of Britain has been subjected to very direct plate boundary activity: the results of convergent activity in Devonian and Carboniferous times (between 416 and 299 million years ago) are visible at the surface in southwest England, and in Ordovician to Devonian times (between 490 and 360 million years ago) in Wales, northwest England and Scotland.