
Полная версия
Collins New Naturalist Library
A complex range of variables determines the nature of predation. For one thing the availability of other foods in the environment influences the extent to which a predator concentrates on any particular prey. This also depends on how specialised the predator has become in feeding on restricted categories of prey; kestrels are better equipped to catch ground-living rodents in open country than are sparrowhawks, and these in turn are more efficient at catching small birds in flight in wooded areas. Prey-species have evolved an enormous range of anti-predator devices, the more so if they are subject to intense attack. These protective devices vary from breeding in colonies to the various forms of camouflage and cryptic behaviour and the possession of special defence organs. Some invertebrates and the eggs of some birds are distasteful to predators, and the list could be longer. Whatever anti-predator adaptation has evolved, it is likely that this is also subject to limitations. For example, camouflage can only be effective if sufficient concealing backgrounds are available and when these are saturated surplus animals may derive no benefit from being cryptically coloured. Accepting the existence of all these modifying influences, there are two basic aspects to the response shown by a predator to changes of its prey (Solomon 1949). First, there is the response of the individual predator to changing numbers, or, better, to the changing density of its prey (food), this being the functional response of the predator. Second, predators may respond to increases of prey density by increasing their own numbers through immigration or by breeding, and vice versa, and the change in population size of the predator is the numerical response.
The simplest functional response shown by a predator to changes in food density is depicted in Fig. 8 based on the number of cereal grains eaten per unit time by wood-pigeons according to grain density on stubbles or sowings. The response is simple because the birds have little or no other food choice when they search the stubbles; unlike the related stock dove they do not normally respond to the presence of weed seeds. It can be seen that once grain density reaches a particular threshold the birds’ intake rate cannot be increased; this limitation is imposed because a constant amount of time is needed to pick up, manipulate and swallow each grain. The stock dove’s ability to find weed seeds on stubbles and sowings probably depends on it having shorter legs so that it is nearer the ground. In such ways birds have evolved different feeding mechanisms which are efficient in a limited range of feeding situations.
In most circumstances predators have a choice of prey and the particular item they select depends not only on prey density but also on learned individual preferences. This learning ability introduces a sigmoid stage to the functional response curve as shown in Fig. 9. This type of response curve is much more common among vertebrates and has, for instance, been found to apply to the predation by titmice on forest insects (Tinbergen 1960, Mook 1963), and has been produced experimentally with mammals in the laboratory by Holling (1965). The same curve is also found when bait, in the form of beans or peas, is spread on a grain sowing where wood-pigeons are feeding. This characteristic curve has been explained, as follows, by Leopold in 1933 and more recently by L. Tinbergen. At very low densities of the specific prey (density 1 for curve A in Fig. 9), few or none are found, and the food of the predator consists entirely of other items (100% other prey). As the specific prey density increases, a point is reached when some individuals are found by chance (density 2 in Fig. 9) and for a while the curve rises with density as chance encounters increase. But at some stage, which varies with the attractiveness of the prey, the predator learns that this particular food is available and makes a special effort to find it. The food is now found more often than by chance alone, and this causes the sigmoid stage to appear in the response curve (between densities 2 and 3 in Fig. 9). In the terminology of Tinbergen the bird now adopts a specific searching image for the prey in question. At even higher prey densities the predator again introduces variety into its diet and from now on the prey is taken at a constant rate (from density 3 onwards for curve A in Fig. 9). The level at which the intake rate of prey or the number of prey caught becomes constant depends on its palatability, that is, to what extent it is the preferred food of the predator. A high level (curve B in Fig. 9) would be found for a highly preferred prey (or in the absence of a very good alternative), as when wood-pigeons feed on tic beans spread on a clover pasture. The beans (curve B) are much preferred to clover. If the tic beans are scattered on a grain sowing, the response to beans more closely approximates to curve A because cereals are a preferred food. Nevertheless, the shape and characteristics of the response curve remain unchanged. Buzzards, as will be discussed, feed to a large extent on rabbits, if these are available. In Fig. 9 the rabbit could be represented by curve A and at pre-myxomatosis densities by the vertical line 3, that is, up to 80% of the buzzard’s diet is comprised of rabbits, other prey making up the remainder. Following myxomatosis, which virtually eliminated rabbits for a few years, the buzzards’ diet had to change in favour of other prey, and their feeding response with regard to rabbits could now be represented by the vertical line 1. As with the simple response already considered, it is important to note that above a certain point increase in prey density still does not result in a higher proportion being eaten. There is no reason why the activities of a pest-control operator or a gamekeeper would not obey curves of this kind. When an operator can kill only relatively small proportions of a pest animal, it is necessary to ensure that he does not switch from one pest to another depending on the ease of catching. For example, a rabbit catcher might undesirably be ignoring rabbits at low densities, to concentrate on catching and killing moles, pigeons and other species.
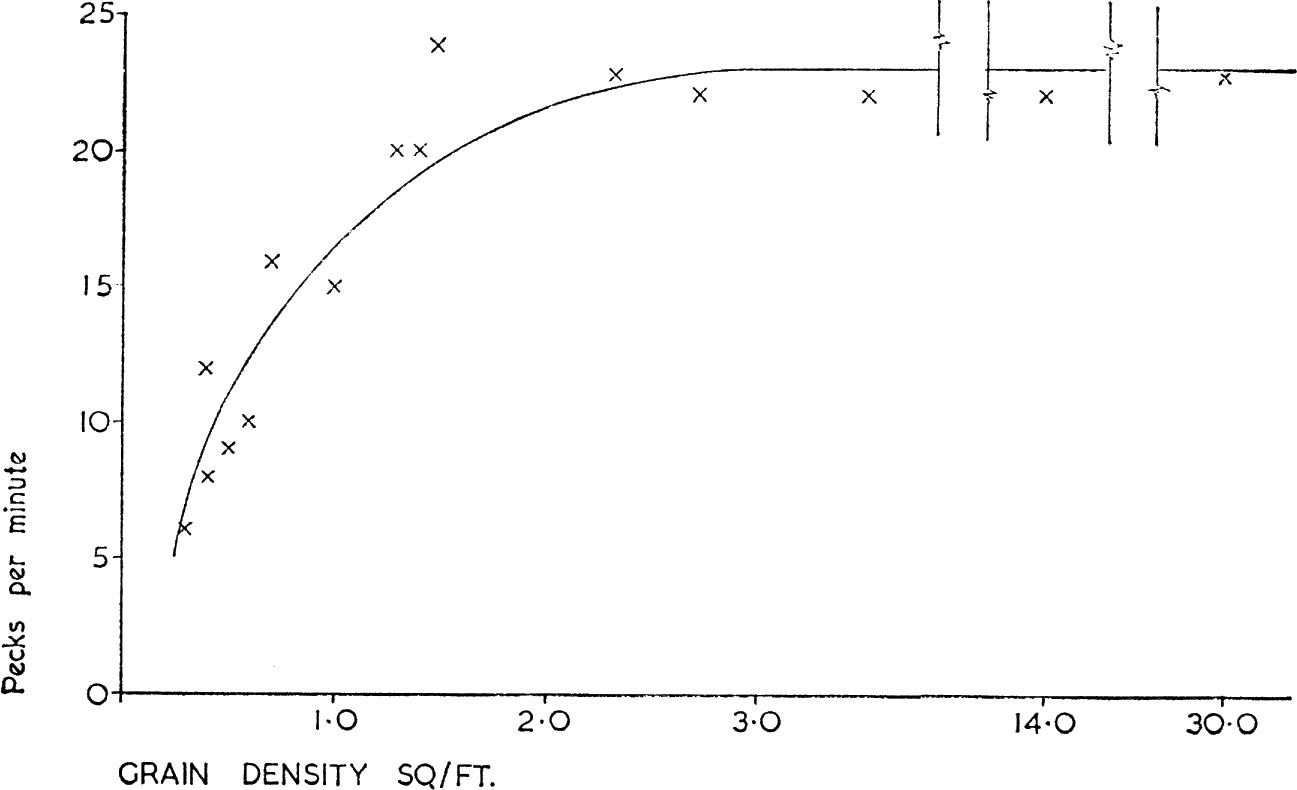
FIG. 8. Number of cereal grains eaten per minute by wood-pigeons depending on grain density. Note that the scale on the abscissa and the actual graph are broken to save space. (From Murton 1968).
Any numerical responses shown by bird predators to changes in the density of their prey can most rapidly be achieved by emigration or immigration; more permanent changes dependent on reproduction must necessarily be slow and delayed, because birds have restricted breeding seasons. Figure 10, based on Mook (1963), shows how the numbers of bay-breasted warblers which settled to breed in certain Canadian conifer forests, after they had returned from migration, varied according to the density of the third instar larvae of the spruce budworm Choristoneura fumiferana. The response did not depend on the reproductive rate of the warblers: it resembles the behaviour of certain arctic birds of prey, like the snowy owl, which settle to breed in the Canadian arctic and in Scandinavia in those years when lemmings are abundant, and is similar to the behaviour of the short-eared owls already mentioned. There are, however, many cases in which a bird predator shows no numerical response to a specific prey component. An example is discussed below (see here) where it was found that numbers of wintering oystercatchers showed little variation over several seasons, although their preferred prey, second year cockles, fluctuated widely in numbers. This was because in seasons when second year cockles were scarce the birds fed on cockle spat and the older age groups, so that while oystercatcher numbers may have been related to the total cockle population they were not related to this one specific age group.
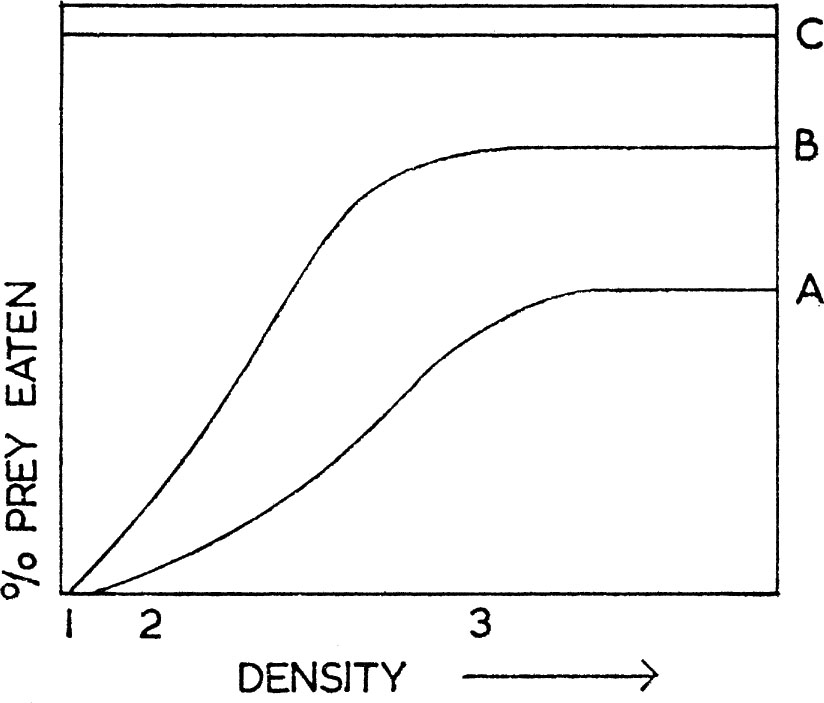
FIG. 9. Functional response of a predator to changes in prey density. The horizontal line C represents the total food of the predator equal to 100%. The proportion of a specific prey, either A or B, eaten by the predator is also shown, depending on changing density of A or B. Consider a predator eating B. At density 1 none is found and the predator’s diet is composed of 100% of C (this could be many different items considered in toto). At density 3, 80% of the diet is composed of B and 20%, i.e. C—B, of other things again making a total of 100%C. (Based on Holling 1965).
The synthesis of the numerical and functional responses shown by a predator determines the nature of predation and its significance for the prey concerned, the main possibilities being represented in Fig. 11. Because bird predators must in most cases take time to respond to changes in prey density, any interaction must usually be delayed. The classical predator–prey relationship is shown at A in Fig. 11. Here the predator increases when prey is abundant, causing the prey to decrease. This results in a decrease of the predator, followed again by an increase of the prey. This ideal balance was first demonstrated in laboratory cultures of the protozoan Paramecium by Gause (1934), and was derived theoretically by Lotka (1925) and Volterra (1926). It is rare to find such perfect examples in wild populations, usually because predators have other prey which they turn to when their major source becomes scarce. An apparent case is shown in Fig. 12 which refers to the number of barn owls and kestrels ringed each year, and which may be taken as an index of their actual abundance. Snow (1968) has shown that most of the peaks of kestrels depend on high numbers being ringed in the north of England and south Scotland and they reflect fluctuations in the number of families ringed, not differences in the size of broods. There is no evidence for similar periodic fluctuations in southern England. Moreover, there is good evidence that the vole Microtus agrestis has been particularly abundant in the north of England in the same years that large numbers of kestrels have been found for ringing. But the curves seem to represent a numerical response of the predator, more kestrels settling to breed when vole numbers are high. There is no evidence that the survival rate of nestling or adult kestrels has varied in the different years in a way that would be expected in a classical predator–prey situation.
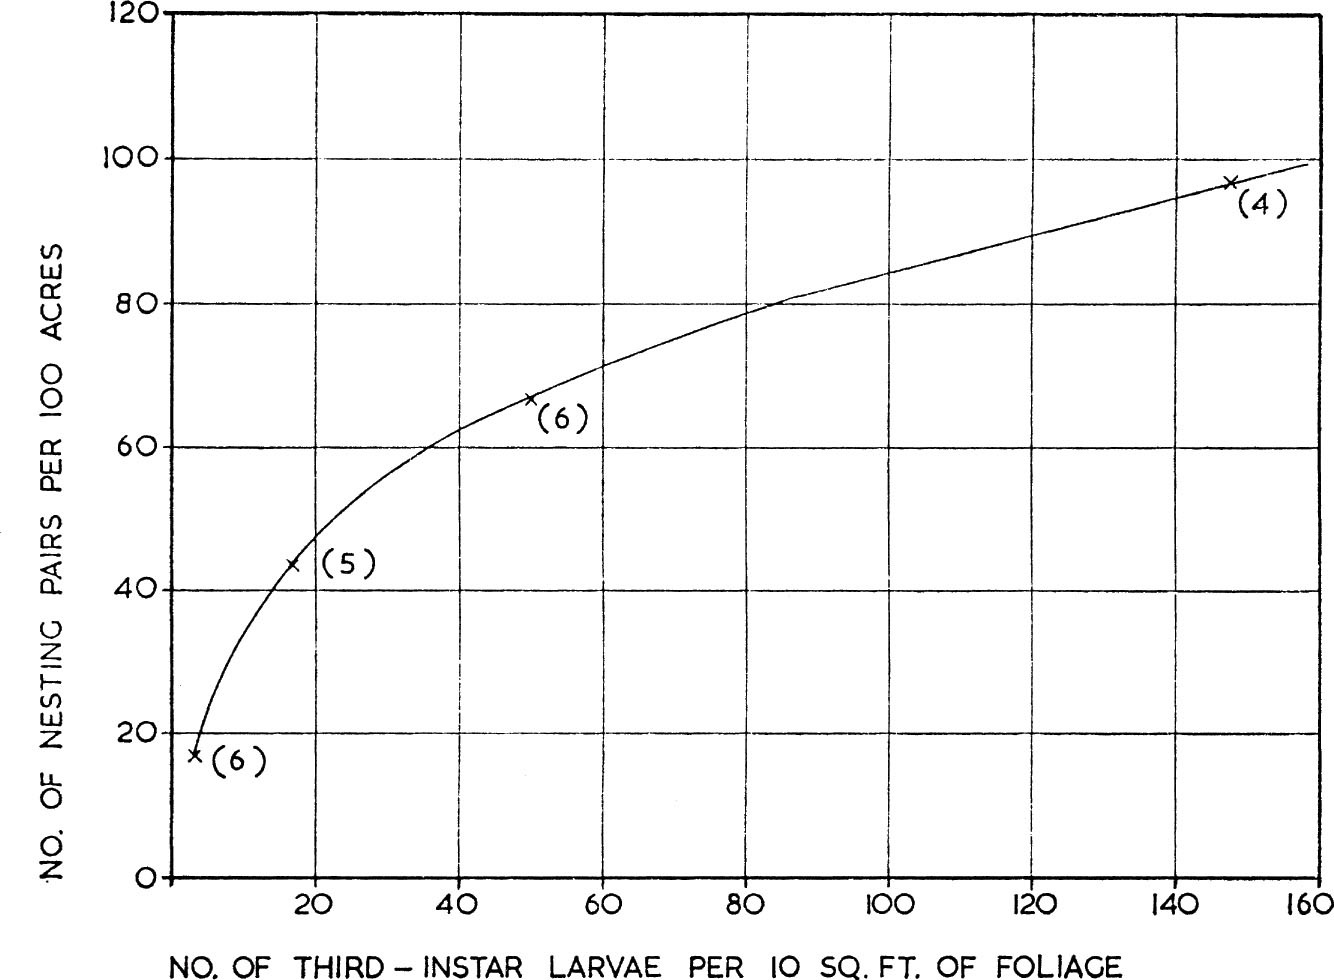
FIG. 10. Numerical response of predator to changes in prey density as shown by the number of nesting pairs of bay-breasted warblers per 100 acres of forest in relation to the number of third-instar larvae of the spruce budworm per 10 sq. ft. of foliage. (From Mook 1963).
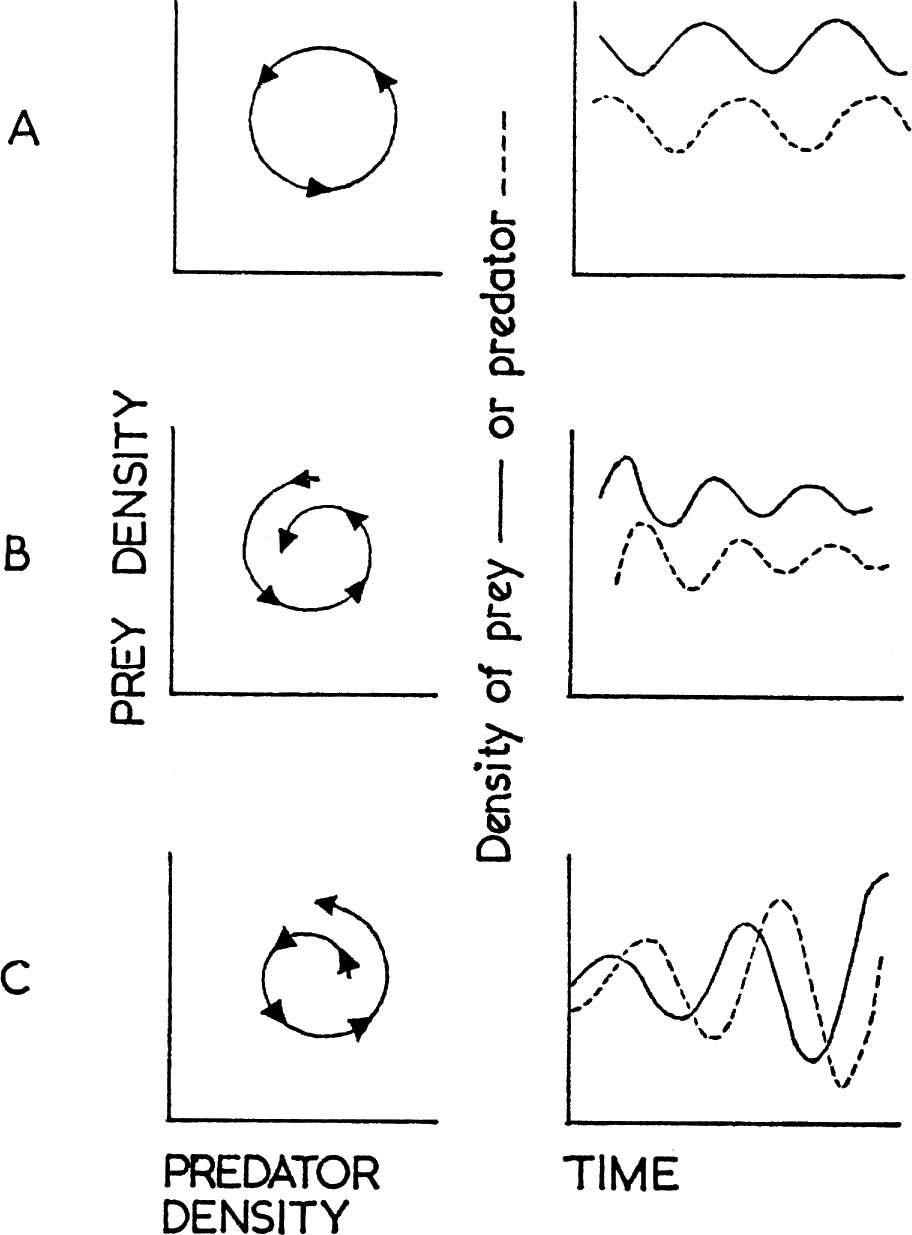
FIG. 11. Three possible interactions between a predator and its prey. On the left the numbers of predator are plotted against numbers of prey and successive points on the time scale chosen (months, years, etc.) joined in chronological order. In the right hand graphs the numbers of prey (solid line) or predator (dotted line) are plotted against time.
A. An increase in prey numbers if followed by an increase of predators which eat the prey, causing a decline in the prey which is followed by a decline in the predator so that with time a steady balance is maintained.
B. Predator density increases relative to prey density so that the regular oscillations shown at A become damped.
C. Prey density increases relative to predator numbers and the system become unstable with violent oscillations.
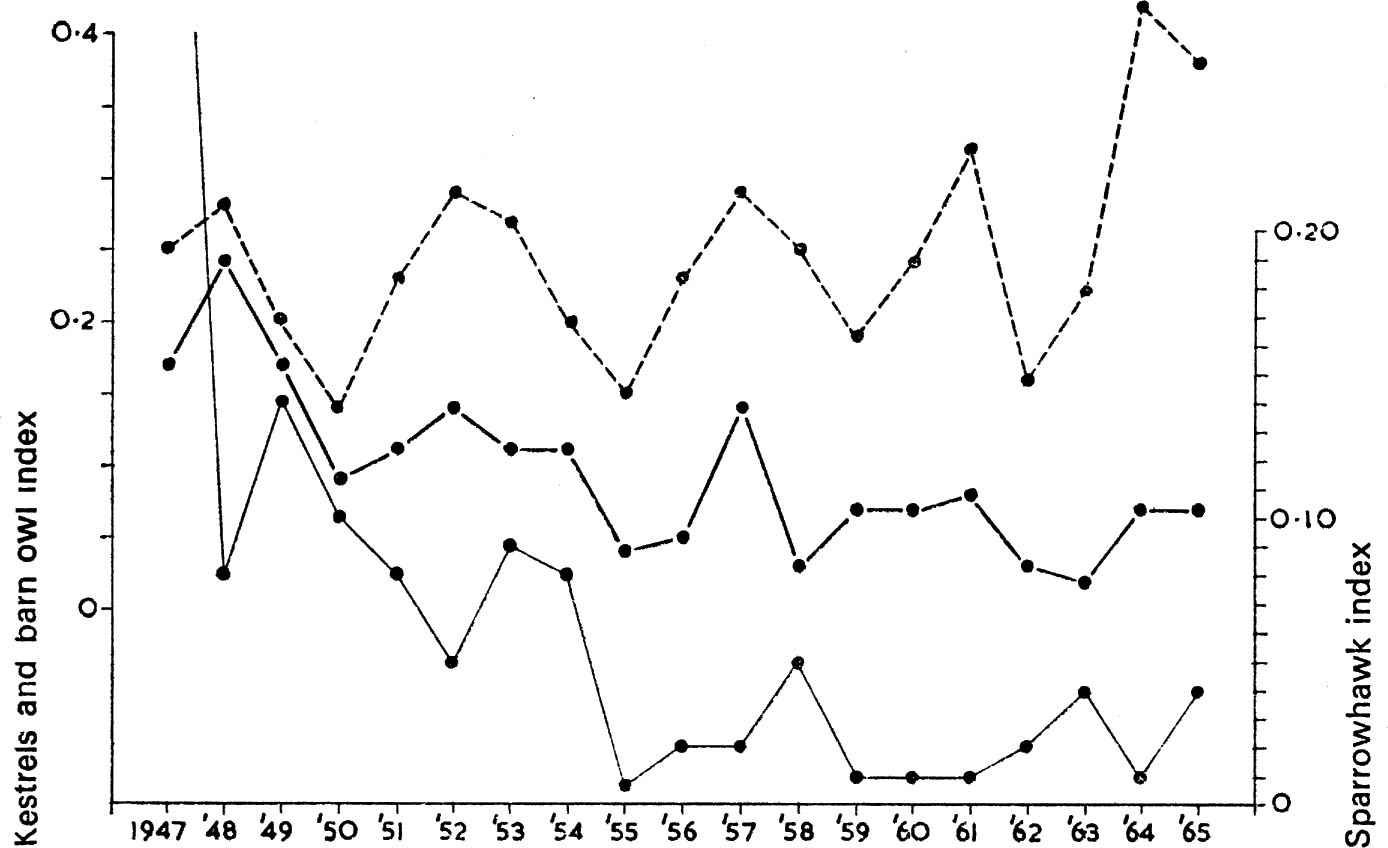
FIG. 12. Number of nestling kestrels (top) barn owls (middle) or sparrowhawks (bottom) ringed each year as a percentage of all nestlings ringed under the British Trust for Ornithology scheme. The ease with which observers find nestlings to ring is assumed to be an index of the populatuon at risk. The kestrel and barn owl feed on the same small rodent species and it is noticeable that their numbers fluctuate in parallel in a manner reminiscent of the classical predator–prey curve depicted in Fig.11a. In contrast, the sparrowhawk feeds on small birds (see Table 3) and its numbers do not fluctuate in the same way. The suggestion of a decline in sparrowhawk numbers is almost certainly a true indication of the changed status of the species due to contamination of its food supply with persistent organochlorine insecticides. The risks of such contamination are very much less for species feeding on small rodents.
Simple systems of this kind are theoretically liable to change to the kind shown at C in Fig. 11, where the oscillations between predator and prey become self-destructive and lead to the extinction of one or the other. Feeding patterns like those shown above density 3 in Fig. 9, where increased prey density is not compensated by an increased predation (in practice more animals would usually move in to take advantage of such good feeding conditions), tend to produce violent fluctuations. One reason that such oscillations rarely occur depends on the complexity of natural ecosystems as was discussed in the previous chapter (see here). Prey is effectively isolated in groups so that if one group is accidentally exterminated it is re-populated in a density-dependent way according to its own food supply; predators tend to be less efficient at very high prey densities; and some prey have refuges enabling them to escape predation. These factors plus the existence of more than one kind of predator all help to dampen the kind of expanding oscillation seen in Fig. 11c.
When the percentage of predation at first increases with rising prey numbers, there is a high probability that oscillations will be damped as in Fig. 11b. If the numbers of an insect increase, a proportional increase in the amount of predation by birds could bring the system back to its old level. There is good evidence from L. Tinbergen’s researches that this is what certain insectivorous birds may achieve in preying on forest insects in the manner shown in the sigmoid part of Fig. 9; fluctuations in prey density can be reduced and predator–prey oscillations damped, so reducing the risk of an infestation developing. But it is clear that if insect density rises beyond the level where the predation curve is S-shaped in Fig. 9, that is, if the prey achieves densities where a smaller proportion is taken with rising density, then the predator could not be held to have a regulating effect. As will be discussed in Chapter 4, birds cannot control an insect plague once it has developed, but they may help prevent it developing in the first instance. From the point of view of pest control or conservation one general lesson following from the above is that predator–prey interactions will be most stable in environments with a diverse structure supporting a wide variety of predators and prey, as for example, natural undisturbed oak woodland. Monocultures of introduced conifers would be expected to provide unstable conditions. Voute’s (1946) observation that outbreaks of insect pests are commoner in pure than in mixed stands of trees is, therefore, of considerable interest and adds weight to the suggestion that forestry policy should aim at intermixing deciduous trees in conifer woods (see here).
It can often happen that a predator takes only a fixed number of the prey with which it is in contact, satisfying its food requirements and allowing the surplus prey to escape. Again, this is an unstable situation which cannot last, either because predator numbers would eventually increase leading to new relationships, or because if the same predators persist in their attacks they will eventually exterminate the prey. Examples are the temporary concentration of birds seeking the invertebrates disturbed by a farmer ploughing a field, the gathering of swallows and martins to feed on the insects blown from a wood in strong wind, and the birds which gather round a locust swarm. Here, the number of prey eaten depends on the number of predators that chances to arrive on the scene, and is not a function of prey density. The scale of losses inflicted by birds on locust swarms seems usually slight. Around a small locust swarm in Eritrea, which covered about ten acres, Smith and Popov noted two or three hundred white storks, many great and lesser spotted eagles, and several hundred Steppe eagles, as well as smaller numbers of black kites, lanner falcons, marabou storks and other species. Shot and dissected storks each proved to have eaten up to 1,000 locusts. But most observers agree that this scale of predation has a negligible effect. More important is the suggestion (e.g. Vesey-Fitzgerald 1955) that birds may be useful in preventing a rapid build-up of locust numbers. Recent evidence from the Rukwa Valley indicates that this is not the case. First, because the preferred feeding habitat of the birds mostly concerned – white stork, cattle egret and little egret – is the short grass area of the lakeshore, whereas the locusts prefer and breed in the long grass associations covering much of the plains. Second, locusts are most abundant from March–June, when bird numbers are low, and decrease for other reasons in July when large numbers of immigrant birds arrive.
When man preys upon wood-pigeons by shooting them on their return to their roosting woods, the number he kills increases slightly when the total population increases, but the percentage shot declines. Each man shoots at the passing flock but can potentially kill only two birds because he uses a double barrel 12-bore gun. More flocks pass when pigeon numbers are high, enabling a higher total of birds to be shot, but the flocks are also much larger and a smaller proportion of each can be killed. Hunting methods impose a limit on a man’s kill, and the only way to achieve a higher rate of predation would be for more men to shoot or for each man to use a faster firing, or otherwise more efficient gun. The first possibility is limited by social considerations; the number of men interested in shooting, either for sport or for monetary gain, is restricted because today there are so many more outlets for pastoral relaxation and the financial reward for shooting pigeons is low. The battue shoots did not usually begin until the end of the pheasant shooting season, in late January and early February, because only then were gameowners prepared to let pigeon shooters wander over the estates. They ended in early March when shooting at dusk on the longer days interfered with the other attractions of evening, the village dance or local hostel. The alternative of using a more lethal weapon would be opposed to the arbitrary code of sportsmanship current in Britain today, a code which imposes operose conditions on the ways animals can be ‘taken’ – a euphemism for ‘killed’. In days when cumbrous muzzle-loading guns prevailed, shooting birds sitting on the ground was acceptable, but fashion changed to ‘shooting flying’ during the eighteenth century as guns improved, and today shooting a sitting bird is unthinkable. Today a similar pretentious scorn is poured upon the American repeater, just as it was upon the double barrelled 12-bore when it first appeared. As Markland (1727) says in Pteryptegia or The Art of Shooting Flying:
he who dares by different means destroy
Than nature meant, offends ’gainst Nature’s law.
A viewpoint all right in sport but with no place in serious pest control.
Sometimes predators take all, or at least a large proportion of, a prey species only when the prey exceed a certain minimum number. This minimum may result from a fixed number of safe refuges, physically or behaviourally determined, in the environment; or may occur because the predator finds it unrewarding to search for prey below a fixed density and moves off elsewhere. Errington showed that a given area of range in Iowa could support a relatively fixed number of bob-white quail in winter irrespective of the autumn population, while the surplus birds were taken by predators. A similar story applies to the red grouse in Glen Esk which have been studied in great detail by D. Jenkins, A. Watson and G. R. Miller. It has already been noted that a territorial system relates grouse numbers to the carrying capacity of the habitat, forcing excess birds to move into less favourable marginal areas. Most of this dispersal takes place during two distinct seasons, from November to December and from February to April, the displaced birds suffer much more from predators than those resident in territories. Knowledge of a territory presumably enables the individual to find hiding places when danger threatens. Of 383 birds individually tabbed which had territories in November the remains of 2% were later found killed by predators, whereas of 261 tagged birds known to be displaced from territories in November as many as 14% were found killed. On high ground (700 m. and above) eagles and foxes accounted for about half the grouse preyed upon, while on low ground (500 m. and below) foxes and hen harriers were about equally responsible for the losses. Table 2 also shows how grouse suffered much more from predators in years when the number known to be dispersing was high. The number of raptors actually hunting in the study area also increased in such years, although roughly a similar total was present in the general area each year. Jenkins et al. presume that the grouse were but one of a number of suitable foods and were only taken when they were particularly vulnerable. In this case the number of predators was not determined by the availability of the specific prey studied; their numbers may have been related to the abundance of all prey animals combined, but this is at present unknown. There are times when it is only the birds dispersed to marginal habitats in ways like those outlined above, that cause economic problems – one case is given below (see here).
At Glen Esk gamekeepers persecuted the predatory birds and mammals at every opportunity. In spite of this, Jenkins et al. showed that slaughter was not controlling these predators because a similar number appeared every year. They point out that the number of predators expected to be killed on the moors of Perthshire and Kincardineshire today are similar to figures quoted in 1906 by Harvie-Brown. Keepers may well reduce breeding numbers slightly, or prevent the breeding of some individuals in early summer, but the relatively large number of young produced on the estates in question and near by, is always sufficient to make good these losses. In other words, gamekeepers merely crop an expendable surplus of predatory birds and mammals, in much the same way as these predators crop their prey – as a man does when he shoots grouse. In the circumstances, it is probably a waste of time for the keepers to set their traps and patrol their estates in search of so-called vermin. As far as grouse are concerned, the most useful employment for the keeper would be to lend a hand with heather burning and help to improve moor management, for this is really what affects grouse numbers, not predator control.
It would be a sophism to infer from this account that the activities of gamekeepers have never been detrimental to the birds of prey, but it is likely that in many cases the senseless slaughter has at most accelerated processes brought about by more fundamental changes, particularly in land use or loss of habitat. Once a species declines and becomes restricted in range through lack of habitat it is far more vulnerable to persecution by man. The osprey was probably always rarer as a breeding bird than some authors have implied, as it was restricted by a need for large lochs with good fish populations, but man’s greed and his continuous persecution eventually caused its extinction in Britain at the turn of the century. The marsh harrier, too, has long been persecuted. In one Suffolk locality two or three pairs regularly nested up to 1951, in spite of egg-collectors (the mentality of one of the men concerned is shown by the fact that in one day he took nine clutches of shoveller from the level where the harriers bred to demonstrate clutch and egg-size variation) and shooting by the keeper of a nearby estate. But it was drainage of the marsh to improve cattle grazing that spelt the final doom for the harriers at this site in the mid 1950s; not just persecution, senseless though it had been.


