Полная версия
Scotland
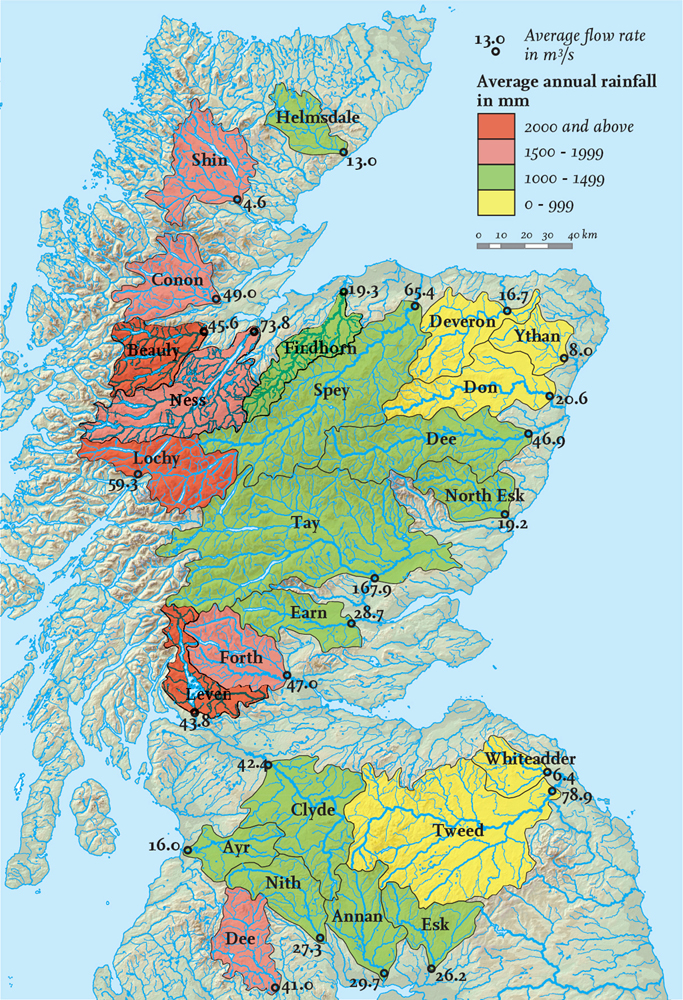
FIG 7. The larger river catchments of Scotland, based on the Scottish National River Flow Archive.
One great contrast between western and eastern Scotland is shown very clearly by the rainfall data averaged over the year and over the catchments, varying from more than 2000 mm to less than 1000 mm per year. The other variable plotted in Figure 7 is river flow rate (in m3/s), averaged over the year from the daily flow rates measured at the river gauge furthest downstream on each principal river. These flow rates give a first feel for the normal size of the river, but, of course, much of the work of rivers in eroding and transporting material is carried out during major floods, so our data give only limited grounds for comparison. Even with these data, it is interesting to see that the Tay (167.9 m3/s) is easily the largest river under most conditions, reflecting its large catchment area and its mid-range rainfall. It is interesting to note that the Thames and the Severn, in England and Wales, which both have large estuaries, have flow rates upstream from the tidal estuaries that are distinctly smaller (66 m3/s and 106 m3/s, respectively).
Some consideration can be given in our Area treatments to the shape and location of the different catchments, and to the bedrock materials and movements that may have been involved. Here the important general point that emerges is that the surface modification processes occurring in these river and valley catchments in Scotland bear a unique responsibility for the changes taking place now in the landscapes that we want to understand better.
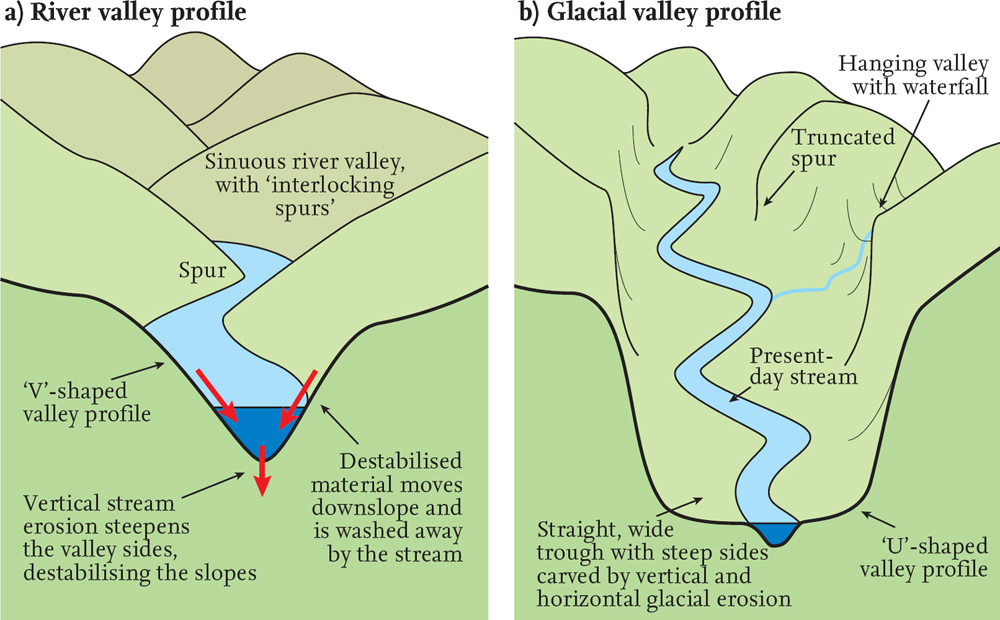
FIG 8. Comparison of valley cross-sections: (a) a simple valley created by channel incision in balance with the valley slope evolution; (b) a valley created by glacial incision and now occupied by a stream channel of similar water discharge to the earlier glacier, but now incising a much smaller channel.
Valleys are bounded by boundary slopes that are inclined downwards towards the stream or river that flows along them. They can therefore be picked out on slope maps as pairs of areas of sloping pixels, providing clear evidence of the action of valley erosion, and the role of channel processes in the erosion of the catchment. Whereas downslope mass movement is a key component in removing material from the catchment, the incision and lowering of the river channel must also exert a control on the extent to which slope materials can be removed and transported down-channel and out of the catchment.
V-shaped cross-valley profiles in upland areas are commonly interpreted as the result of river or stream erosion by the valley channel. In contrast, U-shaped profiles are frequently interpreted as the products of glacial erosion (Fig. 8). It is generally accepted that most upland river valleys have a V-shaped profile, whereas upland valleys that have been occupied by glaciers tend to have U-shaped profiles. This can be readily understood in terms of the small eroding perimeter of a water-filled channel compared with the larger eroding perimeter of the much larger glacier channel, even though the discharge (in m3/s) of rapidly flowing water or slowly moving ice down the valleys may have been similar under the two climatic regimes.
Another climate-related factor should be mentioned at this point. Under periglacial (near-glacial) conditions, freeze–thaw processes, particularly within the surface blanket, will often keep the blanket materials in a state of frequent downslope movement. The degree to which this happens is likely to have a profound influence on the evolution of valley-slope and channel systems.
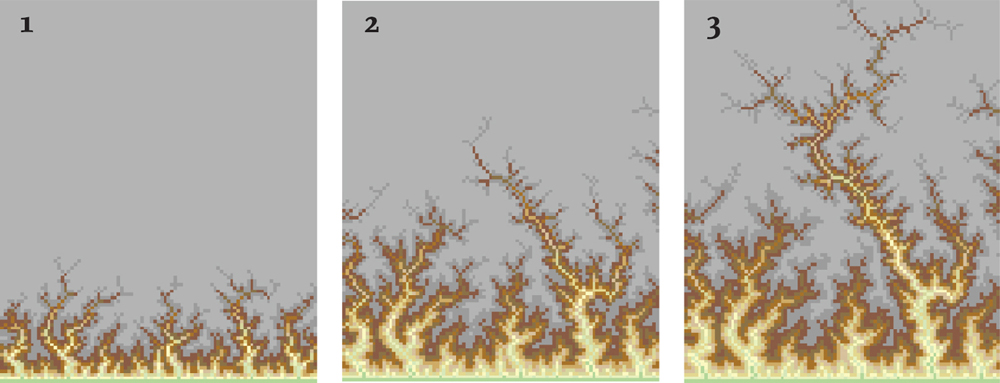
FIG 9. Dendritic channel pattern growth. This shows three phases in the development of a computer-based erosional model, in which valley erosion from the southern edge of a study area proceeds by headward erosion of each valley which is randomly free to choose its erosion direction. The map model was provided by Dimitri Lague and was based on the work of A. Crave and P. Davy.

FIG 10. Other landforms typical of river catchments, including channels of different geometries, flood plains and river terraces.
The catchment map (Fig. 7) shows clearly the dendritic patterns developed by all river and stream drainage systems, and it is these patterns (Fig. 9) that make the recognition of valleys so easy on our slope maps.
In the lower reaches of channel systems, other landforms develop that are typical of deposition of sediment being carried down the system (Fig. 10). This may influence the sinuosity of the channels, so that only slightly sinuous channels, often carrying rather coarse gravel or sandy sediment, may be replaced downstream by meandering (highly sinuous) channels that flow between banks of muddy sediment. Flood plains of relatively fine-grained sediment are increasingly the obvious landforms low down in river systems, and these are typically very flat extensive plains. Terraces often represent fragments of former flood plains left at a higher level as the active channel has cut down to a lower elevation.
SEA COASTS
A special slope consideration is raised by the landscapes of Figure 1, and frequently in other parts of Scotland also. This occurs where a change of sea level has initiated the formation of new coastal landforms, sometimes largely erosional and sometimes depositional (Fig. 11).
Erosion of a coastal slope has similarities to the erosion of river or stream valley slopes, except that coastal slopes are caused by mass downslope movement towards sites of sea-cliff erosion. A very different situation occurs where sea-level changes initiate the deposition of sediment to form coastal flats, with very flat overall slopes, and patterns of coastal sediment bars, sediment flats and salt-marshes. Sediment supply is obviously a key factor in the growth of potentially extensive landforms and landscapes, often with distinctive landforms and very flat surfaces or zero-angle overall slopes.
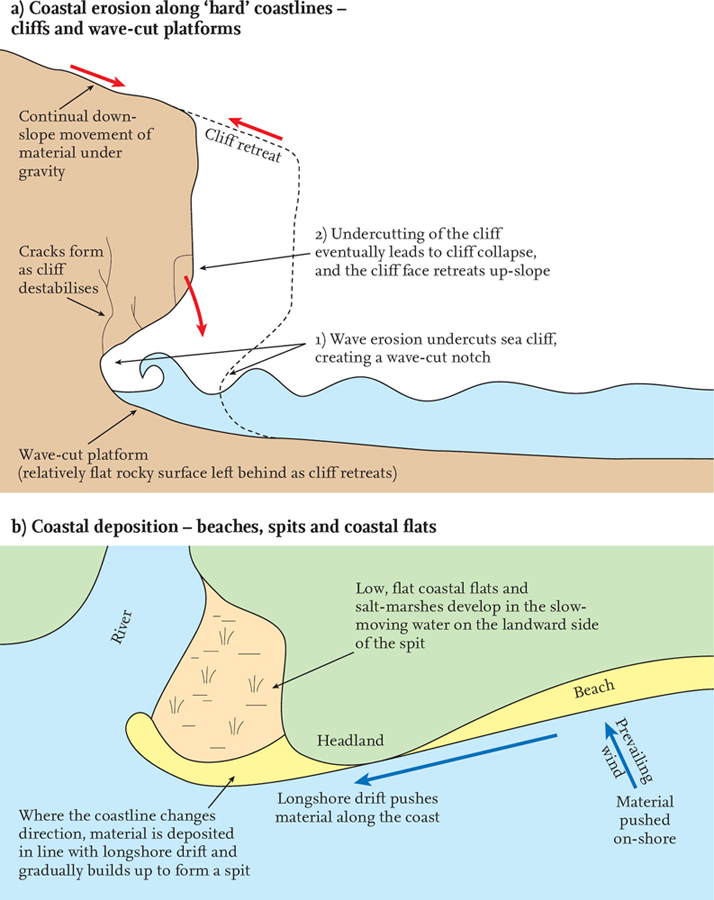
FIG 11. Coastal slopes: erosion and deposition; a) ‘vertical profile’ and b) ‘plan view’.
CHAPTER 3
Movements of the Earth from Within
EARTH-SURFACE MOVEMENTS DUE TO PLATE TECTONICS
TO UNDERSTAND THE CHANGES AND MOVEMENTS affecting the appearance of the landscape on large scales we need to review current understanding of some geological systems, especially plate tectonics. Many of the widespread changes that have created landscapes over long periods of time can now be understood using this discovery.
Knowledge of the processes causing the movement of large areas of the Earth’s surface (10–1000 km length scale) has been revolutionised by scientific advances made over the last 50 years. During this time, scientists have become convinced that the whole of the Earth’s surface consists of an outer shell of interlocking tectonic plates (Fig. 12). The word tectonic refers to processes that have built features of the Earth’s crust (Greek: tekt, a builder). The worldwide plate pattern is confusingly irregular – particularly when seen on a flat map – and it is easier to visualise the plates in terms of an interlocking arrangement of panels on the Earth’s spherical surface, broadly like the panels forming the skin of a traditional leather football.
Tectonic plates are features of the lithosphere, the name given to the ~125 km- thick outer shell of the Earth, distinguished from the material below by the strength of its materials (Greek: lithos, stone). The strength depends upon the composition of the material and also upon its temperature and pressure, both of which tend to increase with depth below the Earth’s surface. In contrast to the mechanically strong lithosphere, the underlying material is weaker and known as the asthenosphere (Greek: asthenos, no-strength). Note that in Figure 13 the crustal and outer mantle layers are shown with exaggerated thickness, so that they are visible.
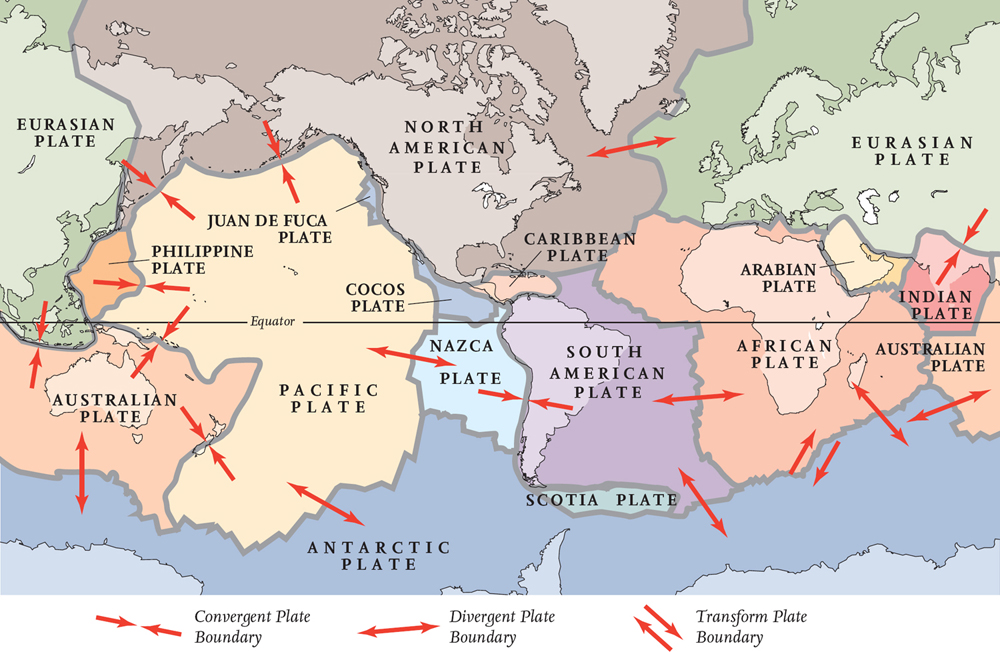
FIG 12. World map showing the present pattern of the largest lithosphere plates.
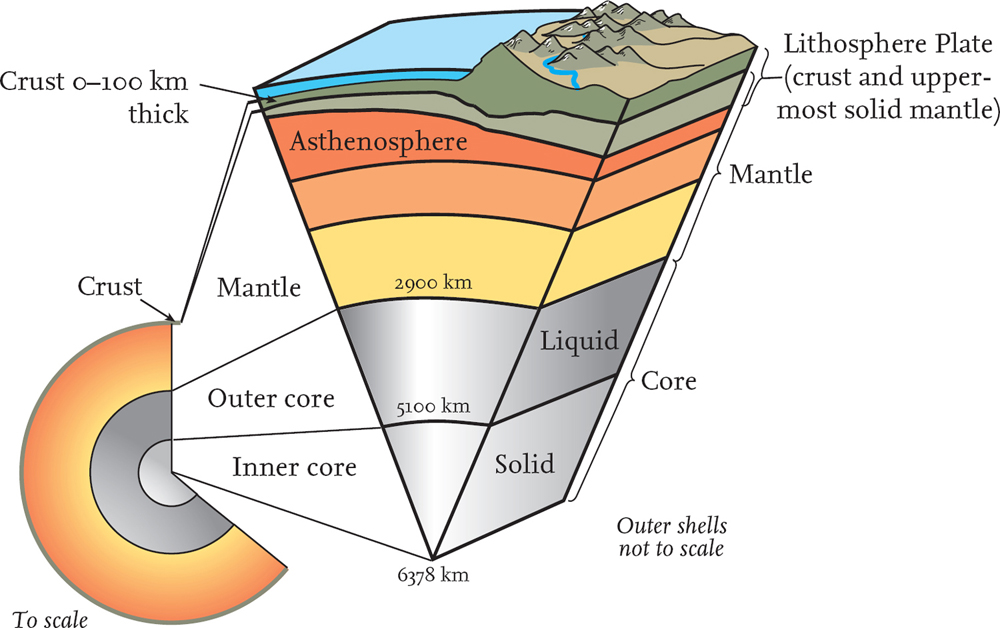
FIG 13. Diagram of the internal structure of the Earth.
Much of the strength difference between the lithosphere and the asthenosphere depends on the temperature difference between them. The lithosphere plates are cooler than the underlying material, so they behave in a more rigid way when forces are generated within the Earth. The asthenosphere is hotter and behaves in a more plastic way, capable of deforming without fracturing and, to some extent, of ‘flowing’. Because of this difference in mechanical properties and the complex internal forces present, the lithosphere plates can move relative to the material below. To visualise the motion of the plates, we can use the idea of lithospheric plates floating on top of the asthenosphere.
The pattern of earthquake activity and actively unstable mountain belts corresponds very well with the pattern of the tectonic plates now recognised. The largest plates (Fig. 12) clearly mark relatively rigid and stable areas of the lithosphere, with interiors that do not experience as much disturbance as their edges. Plates move relative to each other along plate boundaries, in various ways that will be described below. The plate patterns have been located by investigating distinctive markers within the plates and at their edges, allowing the relative rates of movement between neighbouring plates to be calculated. These rates are very slow, rarely exceeding a few centimetres per year, but over the millions of years of geological time they can account for thousands of kilometres of relative movement.
It has proved much easier to measure plate movements than to work out what has been causing them. However, the general belief today is that the plates move in response to a number of different forces. Circulation (convection) within the mantle is driven by temperature and density differences, but other forces are also at play. Where plates diverge, warm material rises from within the Earth to fill the surface gap, and, being warmer, it may also be elevated above the rest of the plate, providing a pushing force to move the plate across the surface of the Earth. At convergent boundaries, cold, older material sinks into the asthenosphere, providing a pulling force that drags the rest of the plate along behind it. Deep within the Earth, the sinking material melts and is ultimately recycled and brought back to the surface to continue the process.
Knowledge of how tectonic plates interact provides the key to understanding the movement history of the Earth’s crust. However, most people are much more familiar with the geographical patterns of land and sea, which do not coincide with the distribution of tectonic plates (Fig. 12). From the point of view of landscapes and scenery, coastlines are always going to be key features because they define the limits of the land; we make no attempt in this book to consider submarine scenery in detail.
The upper part of the lithosphere is called the crust (Fig. 13). Whereas the distinction between the lithosphere and the asthenosphere is based upon mechanical properties related to temperature and pressure, the distinction between the crust and the lower part of the lithosphere is based upon composition. Broadly speaking, there are two types of crust that can form the upper part of the lithosphere: continental and oceanic. An individual tectonic plate may include just one or both kinds of crust.
Continental crust underlies land areas and also many of the areas covered by shallow seas. Geophysical work shows that this crust is typically about 30 km thick, but may be 80–90 km thick below some high plateaus and mountain ranges. The highest mountains in Britain are barely noticeable on a scale diagram comparing crustal thicknesses (Fig. 14). Continental crust is made of rather less dense materials than the oceanic crust, or the mantle, and this lightness is the reason why land surfaces and shallow sea floors are elevated compared to the deep oceans. Much of the continental crust is very old (up to 3–4 billion years), having formed early in the Earth’s life when lighter material separated from denser materials within the Earth and rose to the surface.
Oceanic crust forms the floors of the deep oceans, typically 4 or 5 km below sea level. It is generally 5–10 km thick and is distinctly more dense than continental crust. Oceanic crust only forms land where volcanic material has been supplied to it in great quantity (as in the case of Iceland), or where other important local forces in the crust have caused it to rise (as is the case in parts of Cyprus). Oceanic crust is generally relatively young (only 0–200 million years old), because its greater density and lower elevation ensures that it is generally subducted and destroyed at plate boundaries that are convergent.
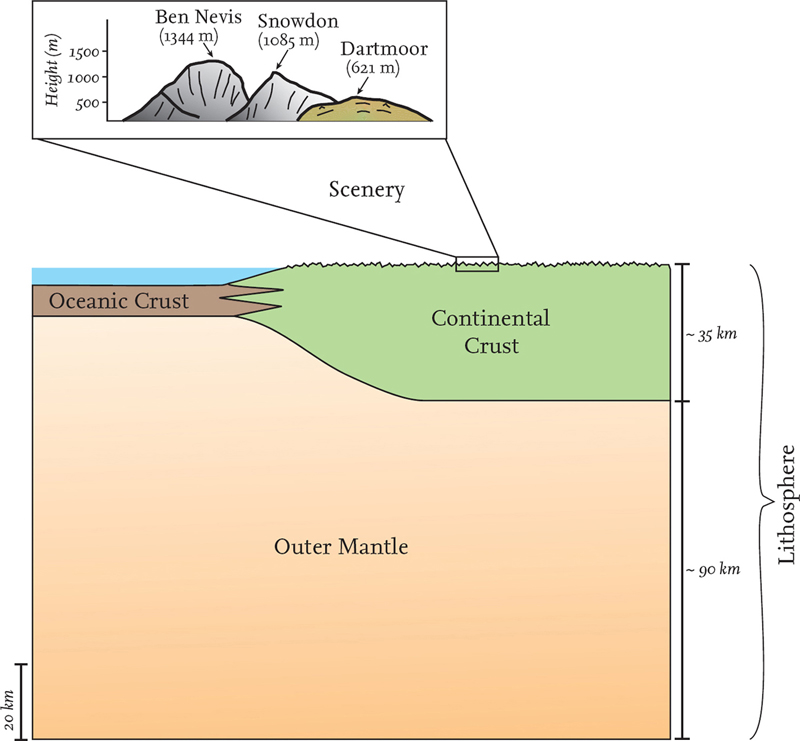
FIG 14. Scale diagram comparing average thicknesses of oceanic and continental crust and lithosphere.
Figure 12 shows the major pattern of tectonic plates on the Earth today. The Mercator projection of this map distorts shapes, particularly in polar regions, but we can see that there are seven very large plates, identified by the main areas located on their surfaces. The Pacific plate lacks continental crust entirely, whereas the other six main plates each contain a large continent (Eurasia, North America, Australia, South America, Africa and Antarctica) as well as oceanic crust. There are a number of other middle-sized plates (e.g. Arabia and India) and large numbers of micro-plates, not shown on the world map.
Figures 12 and 15 also identify the different types of plate boundary, which are distinguished according to the relative motion between the two plates. Convergent plate boundaries involve movement of the plates from each side towards the suture (or central zone) of the boundary. Because the plates are moving towards each other, they become squashed together in the boundary zone. Sometimes one plate moves below the other in a process called subduction, which often results in a deep ocean trench and a zone of mountains and/or volcanoes, as well as earthquake activity (Fig. 15). The earthquakes that happened off Indonesia in December 2004 and off Japan in March 2011 were two of the strongest known since records began. Both seized world attention because of the horrifying loss of life cause by the tsunami waves they generated. Both were the result of sudden lithosphere movements of several metres on faults in the convergent subduction zones where the Australian and Pacific plates have been moving under the Eurasian plate (Fig. 12).
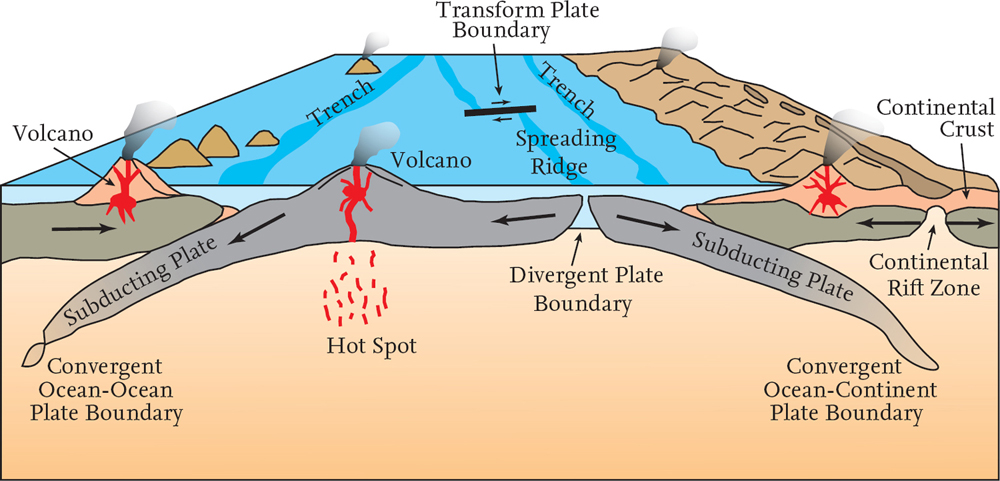
FIG 15. Diagram (not to scale) illustrating the movement processes of plates.
In other cases the plate boundary is divergent, where the neighbouring plates move apart and new material from deeper within the Earth rises to fill the space created. New oceanic crust is created by the arrival and cooling of hot volcanic material from below. The Mid-Atlantic Ridge running through Iceland is one of the examples nearest to Britain of this sort of plate boundary, and volcanic ash-cloud activity there caused widespread disruption to air transport during 2010.
Other plate boundaries, sometimes called transform boundaries, mainly involve movement parallel to the plate edges. The Californian coast zone is the classic example but there are many others, such as the transform boundary between the African and Antarctic plates. In some areas, plate movement is at an oblique angle to the suture and there are components of divergence or convergence as well as movement parallel to the boundary.
Britain today sits in the stable interior of the western Eurasian plate, almost equidistant from the divergent Mid-Atlantic Ridge boundary to the west and the complex convergent boundary to the south where Spain and northwest Africa are colliding. In its earlier history the crust of Britain has been subjected to very direct plate boundary activity. The results of convergent activity in Devonian and Carboniferous times (between 416 and 299 million years ago) are visible at the surface in southwest England, and in Ordovician to Devonian times (between 490 and 360 million years ago) in Wales, northwest England and Scotland (see Chapter 4).
Present-day plate boundaries are often picked out by the location of earthquakes, as described above. Mention should also be made at this point of the importance of volcanoes and igneous bedrock in providing information about movements within the upper levels of the Earth. Highly sophisticated analytical work has illuminated the whole subject of the chemical and mineral evolution of igneous material as it evolves and moves in the crust. For the purposes of this book, a very simple twofold division of igneous rocks into felsic and mafic will be sufficient.
Felsic igneous rocks tend to be light-coloured and of relatively low density, containing the minerals quartz and feldspar. Typical types are granite, syenite (coarsely crystalline) and rhyolite (finely crystalline). Continental crust consists of felsic and mafic igneous rocks, as well as sedimentary and metamorphic rocks.
Mafic igneous rocks tend to be darker-coloured and of relatively high density, containing feldspar and dark minerals rich in magnesium and/or iron, such as augite or hornblende. Typical types are gabbros (coarsely crystalline), andesites and basalts (finely crystalline). Oceanic crust is dominated by mafic igneous materials.
MAKING LOCAL MEASUREMENTS OF EARTH SURFACE MOVEMENTS
We have been considering the large movement systems that originate within the Earth. There are also more local movement systems operating on the Earth’s surface, which are linked to a very variable degree to the large-scale movements of plate tectonics. To explore this complex linkage further, it will be helpful to look now at different processes that may combine to cause particular local movements.
Tectonic plates are defined by their rigidity, so there is relatively little horizontal movement between points within the same plate, compared to the deformation seen in plate boundary zones. This extreme deformation may involve folding and fracturing of the rock materials, addition of new material from below, or absorption of material into the interior during subduction.
Nonetheless, deformation is not restricted solely to plate boundaries and does occur within the plates, although to a lesser extent. In some cases, major structures that originally formed along a plate boundary can become incorporated into the interior of a plate when prolonged collision causes two plates to join. The Caledonian convergent boundary that extended across Scotland (see Chapter 4) provides an excellent example of movements that occurred hundreds of millions of years ago, but also contains many examples of structures formed in later movements. These structures have often been reactivated long after they first formed in order to accommodate forces along the new plate boundary via deformation within the plate. Conversely, changes of internal stress patterns can sometimes lead to the splitting of a plate into two, forming a new, initially divergent plate boundary. Many of the oil- and gas-containing features of the North Sea floor (Fig. 2) originated when a belt of divergent rift faults formed across a previously intact plate.
It needs to be stressed that the patterns of deformation (fracturing and folding) due to these plate motions occur at a wide range of different scales, from centimetres to thousands of kilometres. Sometimes they are visible at the scale of an entire plate boundary, such as the enormous Himalayan mountain chain that marks the collision of India with Asia.
The effects of features as large as plate boundaries on landscapes persist over hundreds of millions of years, long after the most active movement has ceased. For example, parts of southwestern England, Wales and the Scottish Highlands are underlain by bedrocks that were formed in convergent boundary zones of the past. The tin and lead mines of Cornwall owe their existence to a 300-million-year-old convergent plate boundary, where an ocean was destroyed as two plates converged and continents collided. The convergence released molten rock that rose in the crust and gradually cooled to form granite, whilst metals were precipitated in the surrounding crust as ‘lodes’ containing tin and lead (see Chapter 4).
Mapping the patterns of bedrock exposed at the surface often reveals folds and faults that provide key information about the movements that have taken place during the past (Fig. 16). Figure 17 provides a key to some of the terms commonly used to classify these structures, as a step towards understanding the sorts of movement patterns that they represent. In broad terms, folds tend to indicate some form of local convergent movement, though they may be the result of larger movement patterns of a different kind. Normal faults tend to indicate divergent or stretching movements, at least locally, whereas reverse and strike-slip faults tend to indicate convergence. Two broad types of fold are distinguished: synclines are U-shaped downfolds, while anticlines are the opposite – A-shaped upfolds.
Further mapping of folds and faults often reveals complex patterns of changing movements. A complex example is shown in Figure 18. Divergent movements in an area of crust produced plastic deformation in the warmer lower crust, and faulting into a number of discrete blocks in the colder, more brittle upper crust. This was then followed by an episode of convergent movement that resulted in closing up the upper crustal blocks and further flow in the plastic lower crust, causing crustal thickening and mountain building at the surface.
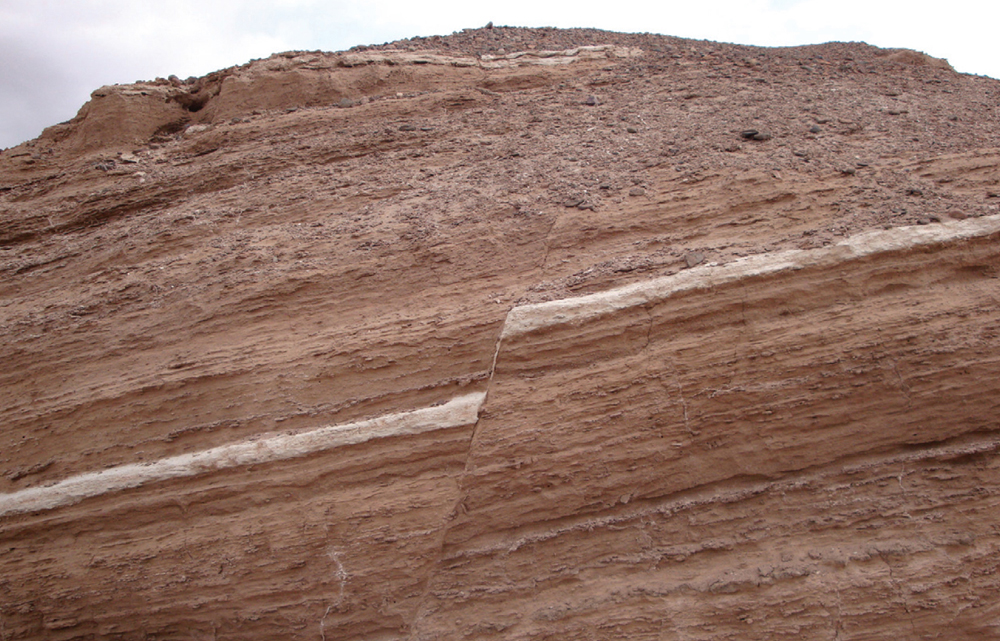
FIG 16. Outcrop in the Atacama Desert, Chile, showing a very regularly bedded succession of mudstones, formed originally as horizontally layered deposits in a lake. Since their deposition the mudstones have been tilted. They have also been fractured during an earthquake, resulting in a step, or normal fault (see Fig. 17), that is particularly clear because it has cut through a white layer in the deposits. An outcrop such as this makes it possible to measure the local movements that have taken place in this material after it was deposited. (© Nicholas Branson)
VERTICAL CRUSTAL MOVEMENTS
The movement of lithospheric plates, as described above, is the main cause of horizontal convergent and divergent movements affecting thousands of kilometres of the Earth’s surface. As shown in Figures 16 to 18, horizontal movements are generally accompanied by vertical movements of local crustal surfaces. Some of these could have produced very large scenic features, such as a mountain belt or a rift valley. In this book we are primarily concerned with scenic features at a more local scale, so we now consider various other processes that may contribute to the creation of vertical crustal movements.
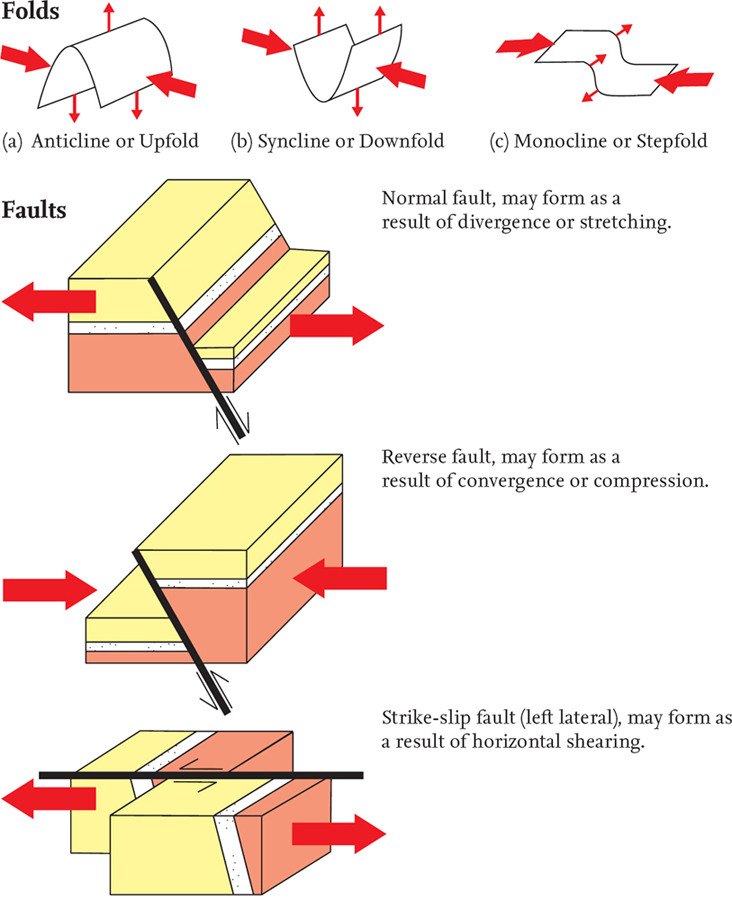
FIG 17. The most important types of folds and faults, and the local patterns of forces responsible.