

Полная версия
What does it mean, then, when they sit down to a project that doesn't whet their appetite? What does it mean for them to have to work on a poorly defined issue where their skills become bragging rights for executives but don't actually solve meaningful problems?
It means many data workers are dissatisfied at their jobs. Having them work on problems overly focused on technology with ambiguous outcomes leads to frustration and disillusionment. Kaggle.com, where data scientists from all over the world compete in data science competitions and learn new analysis methods, posted a survey and asked data scientists what barriers they face at work.9 Several of the barriers, listed here, are directly related to poorly defined problems and improper planning:
■ Lack of clear question to answer (30.4% of respondents experienced this)
■ Results not used by decision makers (24.3%)
■ Lack of domain expert input (19.6%)
■ Expectations of project impact (15.8%)
■ Integrating findings into decisions (13.6%)
This has obvious consequences. Those who aren't satisfied in their roles leave.
CHAPTER SUMMARY
The very premise and structure of this book is to teach you to ask more probing questions. It starts with the most important, and sometimes hardest, question: “What's the problem?”
In this chapter, you learned ways to refine and clarify the central business question and why problems involving data and analysis are particularly challenging. We shared five important questions a Data Head should ask when defining a problem. You also learned about early warning signs to spot when a question starts to go off track. If the question hints of having a (1) methodology focus or a (2) deliverable focus, it's time to hit pause.
When these questions are answered, you are ready to get to work.
CHAPTER 2
What Is Data?
“If we have data, let's look at data. If all we have are opinions, let's go with mine.”
—Jim Barksdale, former Netscape CEOMany people work with data without having a dialect for it. However, we want to ensure we're all speaking the same language to make the rest of the book easier to follow. So, in this chapter, we'll give you a brief crash course on data and data types. If you've had a basic statistics or analytics course, you'll know the terms that follow but there may be parts of our discussion not covered in your class.
DATA VS. INFORMATION
The terms data and information are often used interchangeably. In this book, however, we make a distinction between the two.
Information is derived knowledge. You can derive knowledge from many activities: measuring a process, thinking about something new, looking at art, and debating a subject. From the sensors on satellites to the neurons firing in our brains, information is continually created. Communicating and capturing that information, however, is not always simple. Some things are easily measurable while others are not. But we endeavor to communicate knowledge for the benefit of others and to store what we've learned. And one way to communicate and store information is by encoding it. When we do this, we create data. As such, data is encoded information.
An Example Dataset
Table 2.1 tells the story of a company. Each month, they run a different marketing campaign online, on television, or in print media (newspapers and magazines). The process they run generates new information each month. The table they've created is an encoding of this information and thus it holds data.
A table of data, like Table 2.1, is called a dataset.
Notice that it has both rows and columns that serve specific functions in how we understand the table. Each row of the table (running horizontally, under the header row) is a measured instance of associated information. In this case, it's a measured instance of information for a marketing campaign. Each column of the table (running vertically) is a list of information we're interested in, organized into a common encoding so that we can compare each instance.
The rows of each table are commonly referred to as observations, records, tuples, or trials. Columns of datasets often go by the names features, fields, attributes, predictors, or variables.
Know Your AudienceData is studied in many different fields, each with their own lingo, which is why there are many names for the same things. Some data workers, when talking about the columns in a dataset, might prefer “features” while others say “variables” or “predictors.” Part of being a Data Head is being able to navigate conversations within these groups and their preferences.
A data point is the intersection of an observation and a feature. For example, 150 units sold on 2021-02-01 is a data point.
TABLE 2.1 Example Dataset on Advertisement Spending and Revenue
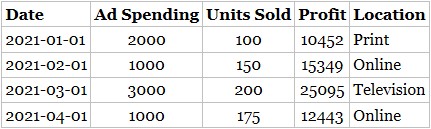
Table 2.1 has a header (a piece of non-numerical data) that helps us understand what each feature means. Note that not every dataset will have a header row. In such cases, the header row is implied, and the person working in the dataset must know what each feature means.
DATA TYPES
There are many ways to encode information, but data workers use a few specific types of encodings that store information and communicate results. The two most common data types are described as numeric or categorical.
Numeric data is mostly made up of numbers but might use additional symbols to identify units. Categorical data is made up of words, symbols, phrases, and (confusingly) sometimes numbers, like ZIP codes. Numeric and categorical data both split into further subcategories.
There are two main types of numeric data:
■ Continuous data can take on any number in a number line. It represents a fundamentally uncountable set of values. Consider the weather. The outside temperature, if collected and turned into data, would represent a continuous variable. A local news station might measure a temperature of 65.62 Fahrenheit. However, they may choose to report this number to you as 65 degrees Fahrenheit, 66 degrees Fahrenheit, or 65.6 Fahrenheit.
■ Count (or discrete) data, unlike continuous data, restricts the precision of the data to a whole number. For example, the number of cars you own can be 0, 1, 2, or more, but not 1.23. This reflects the underlying reality of the thing being measured.10
Categorical data also has two main types:
■ Ordered (or ordinal) data is categorical data with an inherent order. Surveys, for example, take advantage of ordinal data when they ask you to rate your experience from 1−10. While this looks like count data, it's not possible to say the difference between survey ratings 10 and 9 is the same as the difference between 1 and 0. Of course, ordinal categorial data does not have to be encoded as numbers. Shirt size, for example, is ordinal: small, medium, large, extra-large.
■ Unordered (or nominal) categorical data does not have an underlying order to follow. Table 2.1, for example, has a Location feature with values Print, Online, Television. Other nominal variables include Yes or No responses; or Democrat or Republican party affiliation. Their order as presented is always arbitrary—it's not possible to say one category is “greater than” another.
You'll notice Table 2.1 has a Date feature, which is an additional data type that is sequential and can be used in arithmetic expressions like numeric data.
HOW DATA IS COLLECTED AND STRUCTURED
The preceding section talked about data types within a dataset, but there are larger categories to describe data that refers to how it was collected and how it's structured.
Observational vs. Experimental Data
Data can be described as observational or experimental, depending on how it's collected.
■ Observational data is collected based on what's seen or heard by a person or computer passively observing some process.
■ Experimental data is collected following the scientific method using a prescribed methodology.
Most of the data in your company, and in the world, is observational. Examples of observational data include visits to a website, sales on a given date, and the number of emails you receive each day. Sometimes it's saved for a specific purpose; other times, for no purpose at all. We've also heard the phrase “found data” to reference this type of data; it's often created as byproducts from things like sales transactions, credit card payments, Twitter posts, or Facebook likes. In that sense, it's sitting in a database somewhere, waiting to be discovered and used for something. Sometimes observational data is collected because it's free and easy to collect. But it can be deliberately collected, as with customer surveys or political polls.
Experimental data, on the other hand, is not passively collected. It's collected deliberately and methodically to answer specific questions. For these reasons, experimental data represents the gold standard of data for statisticians and researchers. To collect experimental data, you must randomly assign a treatment to someone or something. Clinical drug trials present a common example that generates experimental data. Patients are randomly split into two groups—a treatment group and a control group—and the treatment group is given the drug while the control group is given a placebo. The random assignment of patients should balance out information not relevant to the study (age, socioeconomic status, weight, etc.) so that two groups are as similar as possible in every way, except for the application of the treatment. This allows researchers to isolate and measure the effect of the treatment, without having to worry about potential confounding features that might influence the outcome of the experiment.11
This setup can span across industries, from drug trials to marketing campaigns. In digital marketing, web designers frequently experiment on us by designing competing layouts or advertisements on web pages. When we shop online, a coin flip happens behind the scenes to determine if you are shown one of two advertisements, call them A and B. After several thousand unknowing guinea pigs visit the site, the web designers see which had led to more “click-throughs.” And because ads A and B were shown randomly, it's possible to determine which ad was better with respect to click-through rates because all other potential confounding features (time of day, type of web surfer, etc.) have been balanced out through randomization. You might hear experiments like this called “A/B tests” or “A/B experiments.”
We will talk more about why this discrepancy matters in Chapter 4, “Argue with the Data.”
Structured vs. Unstructured Data
Data is also said to be structured and unstructured. Structured data is like the data in your spreadsheets or in Table 2.1. It's been presented with a sense of order and structure in the form of rows and columns.
Unstructured data refers to things like text from Amazon reviews, pictures on Facebook, YouTube videos, or audio files. Unstructured data requires clever techniques to convert it into structured data required for analysis methods (see Part III of this book).
Is Data One or Many?We should clarify where we stand on a debate you may not have known about or cared existed: Is data one or many?
The word data is actually the plural version of the word datum. (Like criteria—the plural of criterion. Or agenda—the plural of the word agendum.) If we were following proper rules of language, we would say “these data are continuous” and not “this data is continuous.”
Both of your authors have attempted to use the correct phrasing the data are…out in the real world and it's not for us. It just sounds weird. And we're not the only ones who think so. The popular data blog FiveThirtyEight.com12 has argued that its usage is a mass noun, like water or grass.
BASIC SUMMARY STATISTICS
Data does not always look like a dataset or spreadsheet. It's often in the form of summary statistics. Summary statistics enable us to understand information about a set of data.
The three most common summary statistics are mean, median, and mode, and you're probably quite familiar with them. However, we wanted to spend a few minutes discussing these statistics because we frequently see the colloquial terms “normal,” “usual,” “typical,” or “average” used as synonyms for each of the terms. To avoid confusion, let's be clear on what each term means:
■ The mean is the sum of all the numbers you have divided by the count of all the numbers. The effect of this operation is to give you a sense of what each observation in your series contributes to the entire sum if every observation generated the same amount. The mean is also called the average.
■ The median is the midpoint of the entire data range if you sorted it in order.
■ The mode is the most common number in the dataset.
Mean, median, and mode are called measures of location or measures of central tendency. Measures of variation—variance, range, and standard deviation—are measures of spread. The location number tells you where on the number line a typical value falls and spread tells you how spread out the other numbers are from that value.
As a trivial example, the numbers 7, 5, 4, 8, 4, 2, 9, 4, and 100 have mean 15.89, median 5, and mode 4. Notice the mean (average), 15.89, is a number that doesn't appear in the data. This happens a lot: the average number of people in a household in the United States in 2018 was 2.63; basketball star LeBron James scores an average of 27.1 points per game.
It's a common mistake for people to use the average (mean) to represent the midpoint of the data, which is the median. They assume half the numbers must be above average, and half below. This isn't true. In fact, it's common for most of the data to be below (or above) the average. For example, the vast majority of people have greater than the average number of fingers (likely 9.something).
To avoid confusion and misconceptions, we recommend sticking with mean or average, median, and mode for full transparency. Try not to use words like usual, typical, or normal.
CHAPTER SUMMARY
In this chapter, we gave you a common language to speak about your data in the workplace. Specifically, we described:
■ Data, datasets, and multiple names for the rows and columns of a dataset
■ Numerical data (continuous vs. count)
■ Categorical data (original vs. nominal)
■ Experimental vs. observational data
■ Structured vs. unstructured data
■ Measures of central tendency
With the correct terminologies in place, you're ready to start thinking statistically about the data you come across.
CHAPTER 3
Prepare to Think Statistically
“Statistical thinking is a different way of thinking that is part detective, skeptical, and involves alternate takes on a problem.”13
—Frank Harrell, statistician and professorThis chapter is about how you think about data—about arming yourself with a mindset to consume and think critically about data you come across in your business or everyday life. It's laying important groundwork for the rest of the book, yes, but if any of these concepts are new to you, you'll likely find yourself watching the news or reading the latest popular press science articles through a new lens—a statistical lens.
Two important callouts before we start.
First, we're just scratching the surface here. This one chapter isn't going to replace a semester of Statistics (with apologies to any students) or dive into all the psychological aspects of “thinking” like the modern classic Thinking, Fast and Slow.14 But we will introduce several concepts and establish a foundation for statistical thinking, incomplete as it may be.
Second, there is a risk in reading these next few chapters that you will become cynical about data. You might throw your arms up, claiming this statistics nonsense obfuscates the truth under complicated equations and numbers, and swear off any analysis you see. Or maybe you'll throw tomatoes at every article you read because you learned a few tricks of the statistical trade and doubt they know as much as you.
Please don't. Our goal isn't to make you reject the information you see, but to question it, understand it, know its limitations, and perhaps even appreciate it.
ASK QUESTIONS
A core tenet of statistical thinking is “ask questions.”
Many of us do this to some degree in our everyday life. We assume you, as a reader of a book about data, naturally question sure-bet claims from advertisers (“Lose 10 pounds in a month!” or “This hot stock is the next Amazon!”) and bizarre posts on social media. (Open Facebook or Twitter, and you'll probably spot one right now.) So, the muscle is inside of you somewhere. Frankly, it can be fun to sit back as an observer and tear apart the obvious lies.
But it's much harder to do to claims and data personal to us. Every political election shows this. Take a minute to think seriously and honestly about how quickly you become suspicious of claims or numbers from the other political party.15 What goes through your head? “Their sources are bad. My sources are good. Their information is false. My information is true. They just don't understand what's going on.”
Clearly, this discussion can get philosophical very quickly. Our intent isn't to stir up a political debate or dive into the many factors that shape our personal and political ideologies. But there's a lesson to be learned here—it's hard to question everything when the “everything” includes your own thinking and reasoning.
More pertinent to the mission of this book, think about the information you see in the workplace. When you see data sprawled out across spreadsheets and PowerPoint presentations—information that impacts your company's success, your job performance, your possible bonus—is it viewed with any skepticism? In our experience, it's often not. Numbers in a boardroom are viewed as cold hard facts. Truth in black ink, rounded to the nearest decimal.
Why is this? Probably because you don't have time to question, poke and prod, or collect more data. This is the data you have, the data you must act on, and the data you can point to and blame if things don't work out your way. When faced with these constraints and limitations, skepticism turns off, almost reflexively. Another reason, you might suggest, is even if you understand issues with the data, your boss probably doesn't. A chain reaction occurs where everyone assumes that someone else, up the management chain (or even down below), will take the number at face value, and that assumption permeates down to those of us staring at the spreadsheet. They'll assume it's true, so we will act on it as if it is.
Data Heads can push back. And it starts with understanding variation.
Comment on “Statistical Thinking”We're using “statistical thinking” in a general sense, defined in the quote at the beginning of the chapter. You might prefer probabilistic thinking, statistical literacy, or mathematical thinking. No matter which phrase you prefer, all deal with the evaluation of data or evidence.
Some might wonder why this line of thinking is important. Businesses and life in general have gone on without it. So why now? Why should Data Heads care?
In an article titled, “Data Science: What the Educated Citizen Needs to Know,” Harvard economist and physician Alan Garber explains why:16
The benefits of data science are real and have never been more salient or important. Increasingly accurate predictions will make the products of data science more valuable than ever, and will increase interest in the field. The advances can also breed complacency and blind us to flaws. Workers of the future need to recognize not only what data science does to assist them in their work, but also where and when it falls short… . a deeper understanding of probabilistic reasoning and the evaluation of evidence is a general skill that will serve all of them well.
THERE IS VARIATION IN ALL THINGS
Observations vary. This isn't earth-shattering news.
The stock market fluctuates daily, political poll numbers change depending on the week (and the polling firm generating the data), gas prices move up and down, and your blood pressure spikes when the doctor is present but not the nurse. Even your daily commute to work, if you broke it down and measured it down to the second, would be slightly different each day depending on traffic, weather, having to drop kids off at school, or stopping for a coffee. There is variation in all things. How comfortable are you with this?
You've probably accepted—or at least tolerated—this variation into your everyday life and may, in fact, be comfortable with it. (Well, maybe not the stock market swings.) Overall, though, we understand that some things change for reasons we can't always explain. And when it comes to things like filling our tires, pumping gas, or paying the electric bill, we live with these figures being different every time they're measured, so long as they make some intuitive sense. But as we established in the previous section, it's harder to put data personal to our careers or our business under the same microscope.
A business's sales fluctuate daily, weekly, monthly, and yearly. Customer satisfaction survey results can vary wildly one day to the next. If we accept the reality of variation in our lives, we don't need to explain every peak and valley. And yet, this is what businesses will attempt to do. What was done differently the week of high sales? leadership asks. Let's repeat the good, reduce the bad, they'll say. Variation makes people feel helpless about the very things they're paid to know and influence.
When it comes to business, maybe we're not as comfortable with variation as we'd like to imagine.
In fact, there are two types of variation. One type of variation stems from how data is collected or measured. This is called measurement variation. The second is the randomness underlying the process itself. This is called random variation. The difference might seem trivial at first, but this is where statistical thinking becomes important. Are decisions being made in response to random variation that can't be controlled? Or is the variation reflective of some true underlying process that, when surfaced correctly, can be controlled? We all hope for the latter.
Put simply, variation creates uncertainty.
Let's look at one hypothetical scenario and one historical case study of variation causing uncertainty.
Scenario: Customer Perception (The Sequel)17
You're the manager of a retailer, and the corporate office closely monitors customer satisfaction data from your store, collected from customers when they call into the 1-800-number at the bottom of a receipt. The survey asks customers to rate their satisfaction on a scale from 1−10, 10 being “completely satisfied.” (A bunch of other questions are included, but it's only the first question that matters.)
To add to the ploy, corporate only wants 9s and 10s. 8s are as good as 0s. Numbers are aggregated weekly and sent to you, as the store manager, and the corporate office in a PDF file with colorful graphs whose page count is just a little too long for the amount required to deliver this information. And yet, these numbers influence your bonus, and your boss's bonus, and are nervously and obsessively pored over each week as you try to hit your 85% weekly success rate, calculated as the number of 9s and 10s divided by the total number of surveys.