

 полная версия
Practical Exercises in Elementary Meteorology
CHAPTER XIV.
CORRELATION OF CYCLONES AND ANTICYCLONES AND THEIR TEMPERATURES
A. Cyclones.—It follows from the two preceding exercises that some fairly definite distribution of temperature, depending upon the wind direction, should exist around areas of low and high pressure. Try to predict, on the basis of the results obtained in Chapters XII and XIII, what this relation of temperatures and cyclones and anticyclones is. Then work out the relation independently of your prediction, by studying actual cases obtained from the weather maps, as follows:—
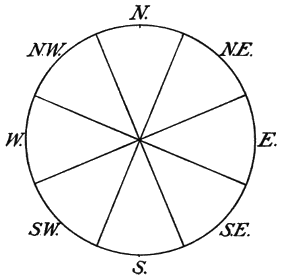
Fig. 50.
Prepare a sheet of tracing paper as shown in Fig. 50. The diameter of the circle should be sufficiently large to include within the circle the average area covered by a cyclone on the weather maps. Place the tracing paper, properly divided in accordance with the figure, over a well-defined area of low pressure on a weather map, centering and orienting it carefully. Take the temperature at the station which lies nearest the center of the figure as the standard. Notice the temperatures at all the other stations which fall within the limits of the circle, and mark down at the proper places on the tracing paper, the + or – departures of these local temperatures from the standard temperature. Thus, if the standard is 37°, and a station has a temperature of 46°, enter +9° at the proper place on your tracing paper. Again, if a certain station has 24°, enter -13° at the proper place on the paper. Continue this process until your paper has all of its divisions well filled. It is best to select all the maps used in this investigation from the same month, for in that case the data are more comparable than if different months are taken. When a sufficient number of examples has been obtained, find the average departure (+ or -) of the temperatures in each division of the tracing from the central standard temperature. Express these averages graphically by means of a wind rose, as in the last exercise.
Another Method.—The above correlation may be investigated by means of another method, as follows:—
Prepare a piece of tracing paper by drawing an N. and S. line upon it, and placing a dot at the center of the line. Lay the paper over an area of low pressure on any weather map, centering and orienting it properly, as in the previous exercises. Trace off the isotherms which are near the center of low pressure. Repeat this process with several maps, selecting different ones from those used in the first part of this exercise. Formulate a rule for the observed distribution of temperature, and determine the reasons for this distribution. Note carefully any effects of the cyclone upon the temperature gradient.
B. Anticyclones.—The correlation of anticyclones with their temperatures is studied in precisely the same way as the preceding correlation. Both methods suggested in the case of cyclones should be used in the case of anticyclones. When your results have been obtained, formulate a general rule for the observed distribution of temperature in anticyclones, and determine the reasons for this distribution.
Find from your composites the average temperature of cyclones and of anticyclones, and compare these averages.
The unsymmetrical distribution of temperature around cyclones, which is made clear by the foregoing exercises, is very characteristic of these storms in our latitudes, and especially in the eastern United States. That this has an important effect upon weather changes is evident, and will be further noted in the chapter on Weather Forecasting. The cyclones which begin over the oceans near the equator at certain seasons, and thence travel to higher latitudes,—tropical cyclones, so called,—differ markedly from our cyclones in respect to the distribution of temperature around them. The temperatures on all sides of tropical cyclones are usually remarkably uniform, the isotherms coinciding fairly closely with the isobars. The reason for this is to be found in the remarkable uniformity of the temperature and humidity conditions over the surrounding ocean surface, from which the inflowing winds come. In the case of our own cyclones, in the eastern United States, the warm southerly wind, or sirocco, in front of the center has very different characteristics from those of the cold northwesterly wind, or cold wave, in the rear, as has become evident through the preceding exercise. These winds, therefore, naturally show their effects in the distribution of the temperatures in different parts of the cyclonic area.
CHAPTER XV.
CORRELATION OF THE DIRECTION OF THE WIND AND THE WEATHER
Select a file of daily weather maps for some month. Commencing with the first map in the set, observe the weather and the direction of the wind at a considerable number of stations in the same general region (as, e.g., the Lake region, the lower Mississippi Valley, the Pacific Coast, etc.). Enter each case in a table, similar to Table IV below, by making a check in the column under the appropriate wind direction and on a line with the appropriate type of weather.
Table IV.—Correlation of the Direction of the Wind and the Weather.
Count every observation of rain or snow also as cloudy, for it usually rains or snows only when the sky is cloudy. Continue your observations on all the maps for the month you have chosen. Then count up the whole number of cases of clear weather you have found with north winds, and write down this sum in the first space, in the column reserved for N. winds. Do the same with fair and cloudy weather. Add up and enter at the bottom of the column in the space marked Totals the whole number of observations of clear, fair, and cloudy weather you have observed with N. winds. Then find what percentage of the weather with N. winds was clear, and enter this percentage next to the sum of clear weather observations, in the first division in the column headed N. Do the same for fair, cloudy, and rainy or snowy weather, deriving the percentages of rain or snow from the total of clear and fair and cloudy. Repeat this process of summarizing in every column. Your results will then show the percentages of the different kinds of weather noted with the different wind directions.
The lower division of the table and the last two columns on the right are to be used for a general summary of the whole investigation. By adding together all the totals of clear, fair, and cloudy weather observed with all the eight wind directions you obtain the whole number of observations you have made. Enter this in the space marked A, at the right of the table. From this grand total and the total number of observations in each column you may find (in percentages) the relative frequencies of the different wind directions. These should be entered under the totals at the bottom of each column, in the spaces marked Percentages (spaces B, C, etc.). The total number of observations of clear, fair, cloud, and rain or snow, noted with all the wind directions, are to be entered in spaces D, F, G, and H, at the right of the table. From these totals, and from the grand total in space A, we can determine the relative frequency (in percentages) of each kind of weather during the month. These results should be entered in spaces J, K, L, and M.
Study these results carefully. Formulate them in a brief written statement. Express graphically the following:—
A. The percentages of frequency of the different wind directions during the month.
B. The percentages of the different kinds of weather noted during the whole month for all wind directions.
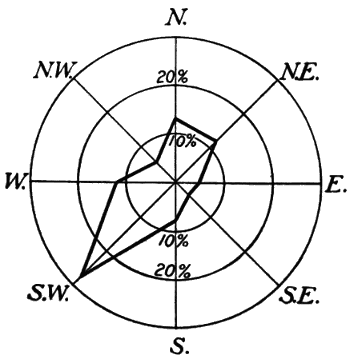
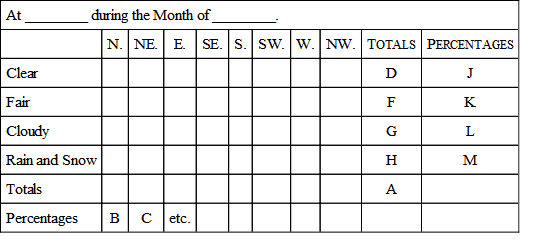
Fig. 51.
A wind rose, indicating the percentages of frequency of different winds during a month, or a year, or several years, may be constructed as shown in Fig. 51.
A certain convenient scale is adopted as representing a frequency of 10%, and a circle is drawn with this unit as a radius. A second circle, with a radius twice as long, represents a frequency of 20%, and a third circle, with a radius three times as long, represents a frequency of 30%. Additional circles may be added if necessary. Distances corresponding to the different percentages of frequency of the eight wind directions are then laid off along the eight radii of the circles, and the points thus fixed are joined by a line.
The results asked for under question B may be plotted as a weather rose on a diagram similar to that above figured. In this case the percentages of frequency of the different varieties of weather (clear, fair, cloudy, stormy) may be indicated on the same figure by using different kinds of lines. Thus, a solid line may be employed to represent clear weather; a broken line for fair; a broken and dotted line for cloudy; and a dotted line for stormy weather.
CHAPTER XVI.
CORRELATION OF CYCLONES AND ANTICYCLONES AND THE WEATHER
A. Cyclones.—Prepare a piece of tracing paper as shown in Fig. 52, making the diameter of the outer circle about 1000 miles6 and of the inner circle 500 miles. Place this diagram over a cyclone on any weather map, centering and orienting it carefully. Trace off the weather signs (indicating clear, fair, cloudy, rain or snow) around the cyclonic center from the map on to the tracing paper, taking only observations which are not more than halfway from the cyclonic center to the neighboring anticyclonic center. Repeat this process with successive weather maps until the diagram is well filled in all its different divisions.
A. Draw a line on the tracing paper enclosing the average area of cloud (including rain and snow), and a second line enclosing the average area of precipitation (rain or snow).
B. Determine the percentages of clear, fair, cloudy, and stormy observations for each division of the tracing paper, i.e., (a) for the eight sectors of the large circle; (b) for the whole of the small circle; and (c) for the portion of the diagram between the circumference of the inner circle and the circumference of the outer circle.
Fig. 52.
C. Write out in general terms a description of the weather distribution in cyclones as illustrated by your own investigation.
B. Anticyclones.—This exercise is done in the same way as the preceding one, except that anticyclones are substituted for cyclones.
The association of fair weather with anticyclones and of stormy weather with cyclones is one of the most important lessons learned from a study of the weather maps. The great areas of high and low pressure control our weather. On land, where daily weather maps are so easily accessible, a glance at the map serves in most cases to give a fairly accurate idea of the position and extent of cyclones and anticyclones, and hence also of the distribution of weather. At sea, on the other hand, the navigator has no daily weather maps to refer to, and his knowledge of the weather conditions which he may expect must be gained from his own observations alone. Of these local observations, the pressure readings are by far the most important. A falling barometer usually means the approach of a cyclone, with wind, or storm, or both. A rising barometer, on the other hand, is usually an indication of the fine weather associated with an anticyclone. The unsymmetrical distribution of weather, characteristic of our cyclones in the United States, and also of most cyclones in the Temperate Zone, is associated with their unsymmetrical form, and the unsymmetrical distribution of their temperature already studied. Tropical cyclones have a wonderfully uniform distribution of weather on all sides of their centers, just as they have a symmetrical form and an even temperature distribution all around them.
CHAPTER XVII.
PROGRESSION OF CYCLONES AND ANTICYCLONES
So far no definite study has been made of the changes in the positions of cyclones and anticyclones. If these areas of stormy and fair weather always occupied the same geographic positions, the different portions of the country would always have the same kinds of weather. A knowledge of the movements of the areas of low and high pressure makes weather forecasting possible.
A. Cyclones.—Select a set of daily weather maps for a month. Turn to the first map of the series. Note the position of the center of low pressure, and indicate this position on a blank weather map of the United States by marking down a small circle at the proper place. If there are two or more areas of low pressure on the map, indicate the position of each one of them in a similar way. Turn to the second map of the series, and again enter on the blank map the position of the center of low pressure. Connect the two positions of each center by a line. This line may be called the track of the low pressure center. Continue this process through the whole set of maps, connecting all the new positions with the last positions of their respective centers. Mark each position with the appropriate date in small, neat figures. When completed your map will show at a glance the tracks followed by all the cyclones which traveled across the United States during the month you selected. Study these tracks carefully. Notice whether there is any prevailing direction in which the cyclones move, and whether they show any preference for particular paths across the country. Can you frame a general rule for the prevailing direction and path of movement? Are there any cases which do not accord with the rule? If so, describe them. In what position, with reference to the cyclonic tracks during the month you are studying, is the region in which you are now living?
Next determine the velocities with which these cyclones moved. Prepare a scale of latitude degrees, as described in Chapter V, or of miles, as given at the bottom of the weather map. Measure the distances, in miles, between the successive positions of all the cyclonic centers. Divide these distances by 24 in order to obtain the velocity in miles per hour. What is the highest velocity per hour with which any cyclone moved during the month? What is the lowest? What is the mean, or average, velocity?
Study the tracks and velocities of cyclones in a similar way during several other months. Compare the positions of the tracks, and the velocities of progression, in summer and winter.
B. Anticyclones.—Study the tracks and velocities of anticyclones in precisely the same manner. Compare the results derived from your investigations in the two cases.
Cyclonic Tracks and the Prevailing Westerly Winds.—The correspondence in the direction of movement of most of our cyclones and of the prevailing westerly winds of the Northern Hemisphere (see Chapter IX) will readily be noted. Our weather maps show us the atmospheric conditions over the United States alone, and we can therefore trace the progression of our cyclones over but a limited area of the Northern Hemisphere. An examination of the daily weather maps of the North Atlantic and North Pacific Oceans, which are based on observations made on board ships, and of the weather maps of other countries, shows us that these atmospheric disturbances which appear on our maps may often be traced for long distances across oceans and lands, and that they in reality form a great procession across the northern portion of this hemisphere, and towards and around the North Pole.
The average velocity of cyclones in the United States was carefully determined by Loomis. His observations show that the mean hourly velocity of cyclones for the entire year is 28.4 miles, the maximum (34.2 miles) coming in February, and the minimum (22.6 miles) in August. Over the North Atlantic Ocean the hourly velocity is 18 miles; in Europe, 16.7 miles. The greater velocity of cyclonic movement in the United States in winter recalls what was said at the close of Chapter X concerning the steeper barometric gradient and the more rapid movement of the whole atmosphere over the Northern Hemisphere in winter.
CHAPTER XVIII.
SEQUENCE OF LOCAL WEATHER CHANGES
The next, and last, step in our study of the correlation of the various weather elements concerns the sequence of weather changes at a station before, during, and after the passage of a cyclone and of an anticyclone.
A. Cyclones.—I. Select some station which the weather maps show to have been directly on the track of a well-developed cyclone, i.e., to have been passed over by the center of the cyclone. Note the weather conditions at this station, before, during, and after the passage of the storm. Tabulate your observations according to the following scheme:—
Table V.
Weather Changes at ________________________ during ______________.
In the last column of the table enter the direction and the distance of the cyclonic center from the station, at each observation.
II. Select a station which was north of the track of a cyclone, and tabulate (in a separate table) the weather conditions at that station before, during, and after the passage of the center.
III. Do the same for a station which was south of the track of a cyclone. Repeat these observations for several stations.
B. Anticyclones.—Make a similar series of observations for the passage of an anticyclone centrally over, north and south of, several stations.
Study the sequence of the weather changes shown in the various tables. Deduce a general rule for these changes and write it out.
CHAPTER XIX.
WEATHER FORECASTING
In a letter dated at Philadelphia, July 16, 1747, Benjamin Franklin wrote to his friend Jared Eliot as follows: “We have frequently along the North American coast storms from the northeast which blow violently sometimes three or four days. Of these I have had a very singular opinion for some years, viz.: that, though the course of the wind is from northeast to southwest, yet the course of the storm is from southwest to northeast; the air is in violent motion in Virginia before it moves in Connecticut, and in Connecticut before it moves at Cape Sable, etc. My reason for this opinion (if the like have not occurred to you) I will give in my next.”
In a second letter to the same correspondent, dated Philadelphia, Feb. 13, 1749-50, Franklin states his reasons as follows: “You desire to know my thoughts about the northeast storms beginning to leeward. Some years since, there was an eclipse of the moon at nine o’clock in the evening, which I intended to observe; but before night a storm blew up at northeast, and continued violent all night and all the next day; the sky thick-clouded, dark, and rainy, so that neither moon nor stars could be seen. The storm did great damage all along the coast, for we had accounts of it in the newspapers from Boston, Newport, New York, Maryland, and Virginia; but what surprised us was to find in the Boston newspapers an account of the observation of that eclipse made there; for I thought as the storm came from the northeast it must have begun sooner at Boston than with us, and consequently have prevented such an observation. I wrote to my brother about it, and he informed me that the eclipse was over there an hour before the storm began. Since which time I have made inquiries from time to time of travelers, and observed the accounts in the newspapers from New England, New York, Maryland, Virginia, and South Carolina; and I find it to be a constant fact that northeast storms begin to leeward, and are often more violent there than to windward” (Sparks’s Life of Franklin, VI, 79, 105, 106).
The fact that our northeast storms come from the southwest, which was first noticed by Benjamin Franklin some years before he put the suggestion just quoted in writing, was one of the great contributions to meteorology made by Americans. Modern weather forecasting essentially depends upon the general eastward movement of cyclones and anticyclones, with their accompanying weather conditions.
The daily weather map shows us the actual condition of the weather all over the United States at 8 A.M., “Eastern Standard Time.” The positions of cyclones and of anticyclones; of areas of clear, fair, cloudy or stormy weather, and of regions of high or low temperatures, are plainly seen at a glance. These areas of fair and foul weather, with their accompanying systems of spiralling winds, move across country in a general easterly direction. Knowing something of their direction and rate of movement, we can determine, with greater or less accuracy, their probable positions in 12, 24, 36, or 48 hours. The prediction or foretelling of the weather which may be expected to prevail at any station or in any district is weather forecasting.
Weather forecasts are usually made on our daily weather maps for 24 hours in advance. It is by no means an easy thing to make accurate weather forecasts. Careful study and much practice are required of the forecasters of the Weather Bureau before they are permitted to make the official forecasts which are printed on the daily maps and in the newspapers.
A simple extension and application of the principles learned through the preceding exercises make it possible for us to forecast coming weather changes in a general way. These suggestions are, however, not at all to be considered as a complete discussion of this complicated problem.
Weather forecasts include the probable changes in temperature, wind direction and velocity, and weather. Pressure is not included. Begin your practice in weather forecasting by considering only the changes that may be expected at your own point of observation, and at first confine yourself to predicting temperature changes alone.
Temperature.—Provide yourself with a blank weather map. Draw an isotherm east and west across the map, through your station. Draw a few other isotherms all the way across the map, parallel with the first one, and so arranged that they will be equal distances apart, the most northerly one running through northern Maine and the Northwestern States, and the most southerly one through southern Florida and Texas. Recalling what you have already discovered concerning the eastward movement of our weather conditions, what forecast will you make as to the coming temperatures at your station? Add some additional east and west isotherms, so that there will be twice as many on your map as before. What effect will this change in the temperature distribution on your map have upon the temperature forecast you make for your station? Formulate a general rule as to temperature forecasts under the conditions of isothermal arrangement here suggested.
On a second blank weather map draw an isotherm through your station inclined from northwest to southeast. Draw a few other isotherms parallel to the first, and each one representing a temperature 10° higher than that indicated by the adjacent isotherm on the east. Make a general forecast of the temperature conditions that may be expected at your station, as to kind of change, if any; amount of change, and rapidity of change. Of the isotherms just drawn, erase every second one; still, however, letting those that are left represent differences of temperature of 10°. What forecast will you now make as to temperature? How does this forecast compare with that just made?