

 полная версия
Practical Exercises in Elementary Meteorology

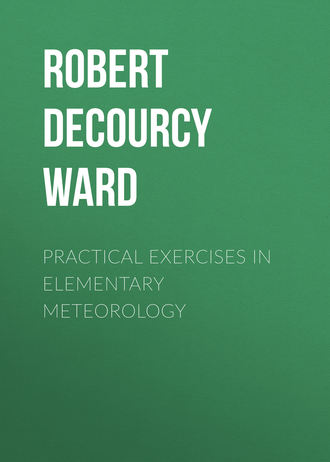
Fig. 40.—Weather. First Day.
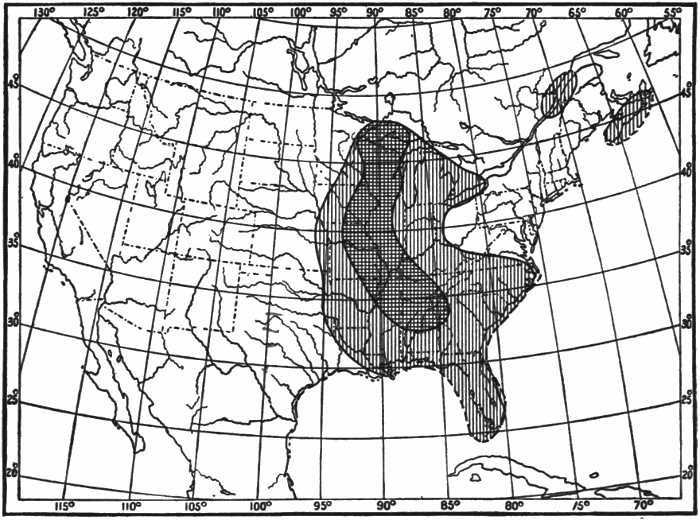
Fig. 41.—Weather. Second Day.

Fig. 42.—Weather. Third Day.
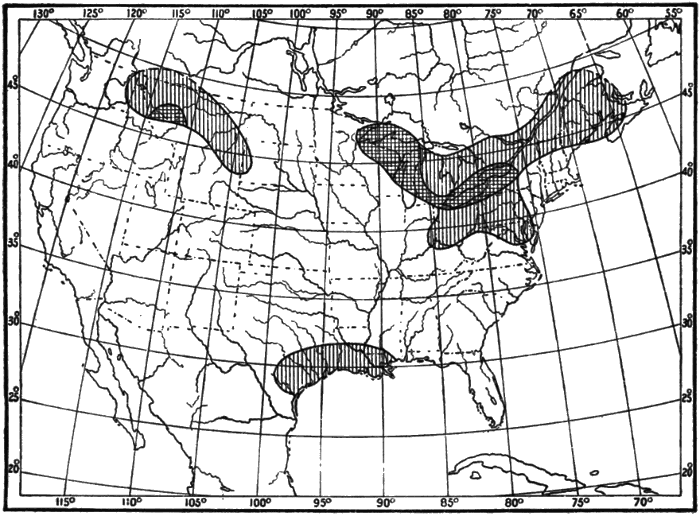
Fig. 43.—Weather. Fourth Day.
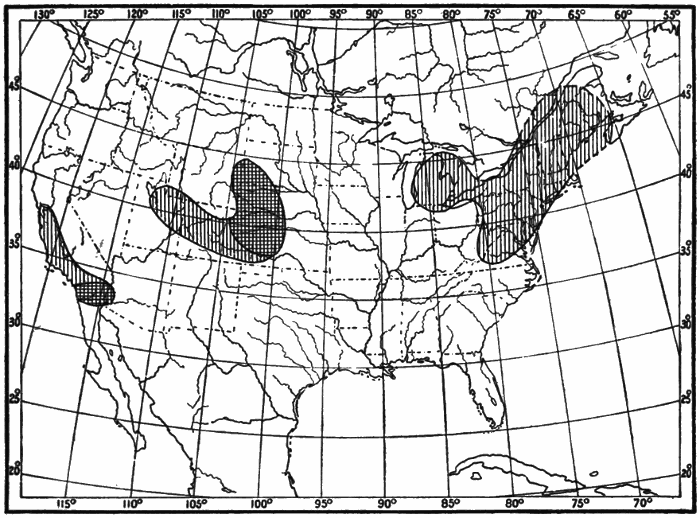
Fig. 44.—Weather. Fifth Day.
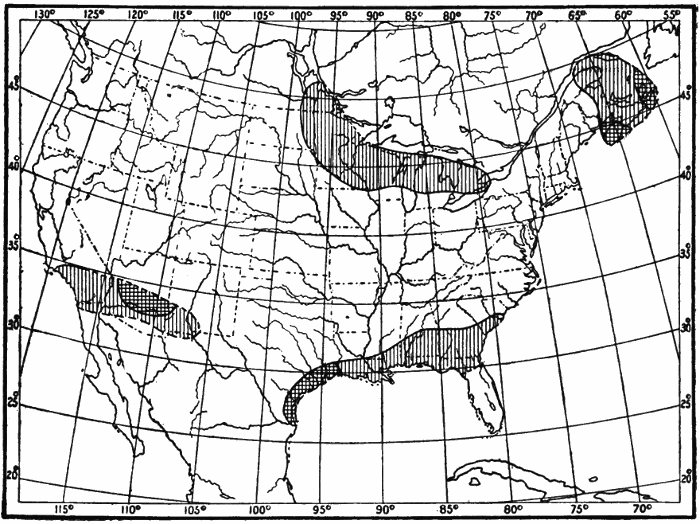
Fig. 45.—Weather. Sixth Day.
The Weather of Temperate and Torrid Zones.—The facts of the presence of clear weather in one region while snow is falling in another, and of the variability of our weather from day to day in different parts of the United States, are emphasized by these charts of weather conditions. This changeableness of weather is a marked characteristic of the greater portion of the Temperate Zones, especially in winter. The weather maps for successive days do not, as a rule, show a repetition of the same conditions over extended regions. In the Torrid Zone it is different. Over the greater part of that zone the regularity of the weather conditions is such that, day after day, for weeks and months, the same features are repeated. There monotony, here variety, is the dominant characteristic of the weather.
Part IV.—The Correlations of the Weather Elements and Weather Forecasting
CHAPTER IX.
CORRELATION OF THE DIRECTION OF THE WIND AND THE PRESSURE
The study of the series of weather maps in Chapters V-VIII has made it clear that some fairly definite relation exists between the general flow of the winds and the distribution of pressure. We now wish to obtain some more definite result as to the relation of the direction of the wind and the pressure. In doing this it is convenient to refer the wind direction to the barometric or pressure gradient at the station at which the observation is made. The barometric gradient, it will be remembered, is the line along which there is the most rapid change of pressure, and lies at right angles to the isobars (Chapter VII).
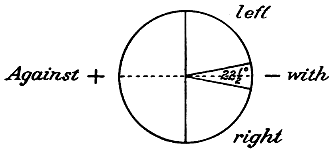
Fig. 46.
Take a small piece of tracing paper, about 3 inches square, and draw upon it a diagram similar to the one here shown. Select the station (between two isobars on any weather map) at which you intend to make your observation. Place the center of the tracing paper diagram over the station, with the dotted line along the barometric gradient, the minus end of the line being towards the area of low pressure. Observe into which of the four sectors (marked right, left, with, against) the wind arrow at the station points. Keep a record of the observation. Repeat the observation at least 100 times, using different stations, on the same map or on different maps. Tabulate your results according to the following scheme, noting in the first column the date of the map, in the second, third, fourth, and fifth columns the number of winds found blowing with, to the right or left of, and against, the gradient.
Table I.—Correlation of the Direction of the Wind and the Pressure.
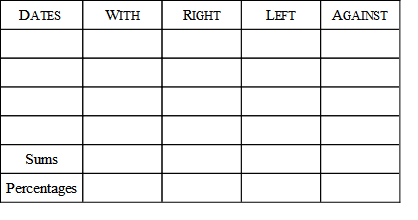
At the bottom of each column write down the number of cases in that column, and then determine the percentages which these cases are of the total number of observations. This is done by dividing the number of cases in each column by the sum-total of all the observations. When you have obtained the percentage of each kind of wind direction, you have a numerical result.
A graphical presentation of the results may be made by laying off radii corresponding in position to those which divide the sectors in Fig. 46, and whose lengths are proportionate to the percentages of the different wind directions in the table. Thus, for a percentage of 20, the radii may be made 1 inch long, for 40%, 2 inches, etc. When completed, the relative sizes of the sectors will show the relative frequencies of winds blowing in the four different directions with reference to the gradient, as is indicated in Fig. 47.
The Deflection of the Wind from the Gradient: Ferrel’s Law.—The law of the deflection of the wind prevailingly to the right of the gradient is known as Ferrel’s Law, after William Ferrel, a noted American meteorologist, who died in 1891. The operation of this law has already been seen in the spiral circulation of the winds around the cyclone and the anticyclone, as shown on the maps of our series. In the case of the cyclone the gradient is directed inward towards the center; in the case of the anticyclone the gradient is directed outward from the center. In both cases the right-handed deflection results in a spiral whirl, inward in the cyclone, outward in the anticyclone. The operation of this law is further seen in the case of the Northeast Trade Winds. These winds blow from about Lat. 30° N. towards the equator, with wonderful regularity, especially over the oceans. Instead of following the gradient and blowing as north winds, these trades turn to the right of the gradient and become northeast winds, whence their name. From about Lat. 30° N. towards the North Pole there is another great flow of winds over the earth’s surface. These winds do not flow due north, as south winds. They turn to the right, as do the trades, and become southwest or west-southwest winds, being known as the Prevailing Westerlies. Ferrel’s Law thus operates in the larger case of the general circulation of the earth’s atmosphere, as well as in the smaller case of the local winds on our weather maps.
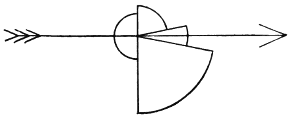
Fig. 47.
CHAPTER X.
CORRELATION OF THE VELOCITY OF THE WIND AND THE PRESSURE
Prepare a scale of latitude degrees, as explained in Chapter V. Select some station on the weather map at which there is a wind arrow, and at which you wish to study the relation of wind velocity and pressure. Find the rate of pressure change per degree as explained in Chapter VII. Note also the velocity, in miles per hour, of the wind at the station. Repeat the operation 100 or more times, selecting stations in different parts of the United States. It is well, however, to include in one investigation either interior stations alone (i.e., more than 100 miles from the coast) or coast stations alone, as the wind velocities are often considerably affected by proximity to the ocean. And, if coast stations are selected, either onshore or offshore winds should alone be included in one exercise. The investigation may, therefore, be carried out so as to embrace the following different sets of operations:—
A. Interior stations.
B. Coast stations with onshore winds.
C. Coast stations with offshore winds.
Enter your results in a table similar to the one here given:—
Table II.—Correlation of Wind Velocity and Barometric
Gradient.
For interior (or coast) stations, with onshore (or offshore) winds, in the United States during the month (or months) of
The wind velocity for each station is to be entered in the column at whose top is the rate of pressure change found for that station. Thus, if for any station the rate of pressure change is 31⁄2 (i.e., .03 inch in one latitude degree), and the wind velocity at that station is 17 miles an hour, enter the 17 in the fourth and fifth columns of the table. When you find that the rate of pressure change for any station falls into two columns of the table, as, e.g., 10, or 5, or 31⁄3, then enter the corresponding wind velocity in both those columns.
In the space marked Sums write the sum-total of all the wind velocities in each column. The Cases are the number of separate observations you have in each column. The Means denote the average or mean wind velocities found in each column, and are obtained by dividing the sums by the cases.
Study the results of your table carefully. Deduce from your own results a general rule for wind velocities as related to barometric gradients.
The dependence of wind velocities on the pressure gradient is a fact of great importance in meteorology. The ship captain at sea knows that a rapid fall of his barometer means a rapid rate of pressure change, and foretells high winds. He therefore makes his preparations accordingly, by shortening sail and by making everything fast. The isobaric charts of the globe for January and July show that the pressure gradients are stronger (i.e., the rate of pressure change is more rapid) over the Northern Hemisphere in January than in July. This fact would lead us to expect that the velocities of the general winds over the Northern Hemisphere should be higher in winter than in summer, and so they are. Observations of the movements of clouds made at Blue Hill Observatory, Hyde Park, Mass., show that the whole atmosphere, up to the highest cloud level, moves almost twice as fast in winter as in summer. In the higher latitudes of the Southern Hemisphere, where the barometric gradients are prevailingly much stronger than in the Northern, the wind velocities are also prevailingly higher than they are north of the equator. The prevailing westerly winds of the Southern Hemisphere, south of latitude of 30° S., blow with high velocities nearly all the time, especially during the winter months (June, July, August). These winds are so strong from the westward that vessels trying to round Cape Horn from the east often occupy weeks beating against head gales, which continually blow them back on their course.
CHAPTER XI.
FORM AND DIMENSIONS OF CYCLONES AND ANTICYCLONES
A. Cyclones.—Provide yourself with a sheet of tracing paper about half as large as the daily weather map. Draw a straight line across the middle of it; mark a dot at the center of the line, the letter N at one end, and the letter S at the other. Place the tracing paper over a weather map on which there is a fairly well enclosed center of low pressure (low), having the dot at the center of the low, and the line parallel to the nearest meridian, the end marked N being towards the top of the map. When thus placed, the paper is said to be oriented. Trace off the isobars which are nearest the center. In most cases the 29.80-inch isobar furnishes a good limit, out to which the isobars may be traced. Continue this process, using different weather maps, until the lines on the tracing paper begin to become too confused for fairly easy seeing. Probably 15 or 20 separate areas of low pressure may be traced on to the paper. It is important to have all parts of the cyclonic areas represented on your tracing. If most of the isobars you have traced are on the southern side of cyclones central over the Lakes or lower St. Lawrence, so that the isobars on the northern sides are incomplete, select for your further tracings weather maps on which the cyclonic centers are in the central or southern portions of the United States, and therefore have their northern isobars fully drawn.
When your tracing is finished you have a composite portrait of the isobars around several areas of low pressure. Now study the results carefully. Draw a heavy pencil or an ink line on the tracing paper, in such a way as to enclose the average area outlined by the isobars. This average area will naturally be of smaller dimensions than the outer isobars on the tracing paper, and of larger dimensions than the inner isobars, and its form will follow the general trend indicated by the majority of the isobars, without reproducing any exceptional shapes.
Write out a careful description of the average form, dimensions [measured by a scale of miles or of latitude degrees (70 miles = 1 degree about)] and gradients of these areas of low pressure, noting any tendency to elongate in a particular direction; any portions of the composite where the gradients are especially strong, weak, etc.
B. Anticyclones.—This investigation is carried out in precisely the same manner as the preceding one, except that anticyclones (highs) are now studied instead of cyclones. The isobars may be traced off as far away from the center as the 30.20-inch line in most cases. When, however, the pressure at the center is exceptionally high, it will not be necessary to trace off lower isobars than those for 30.30, or 30.40, or sometimes 30.50 inches.
Loomis’s Results as to Form and Dimensions of Cyclones and Anticyclones.—One of the leading American meteorologists, Loomis, who was for many years a professor in Yale University, made an extended study of the form and dimensions of areas of low and high pressure as they appear on our daily weather maps. In the cases of areas of low pressure which he examined, the average form of the areas was elliptical, the longer diameter being nearly twice as long as the shorter (to be exact the ratio was 1.94 : 1). The average direction of the longer diameter he found to be about NE. (N. 36° E.), and the length of the longer diameter often 1600 miles. In the case of areas of high pressure, Loomis also found an elliptical form predominating; the longer diameter being about twice as long as the shorter (ratio 1.91 : 1), and the direction of trend about NE. (N. 44° E.). These characteristics hold, in general, for the cyclonic and anticyclonic areas of Europe also. The cyclones of the tropics differ considerably from those of temperate latitudes in being nearly circular in form.
CHAPTER XII.
CORRELATION OF CYCLONES AND ANTICYCLONES WITH THEIR WIND CIRCULATION
A. Cyclones.—Something as to the control of pressure over the circulation of the wind has been seen in the preliminary exercises on the daily weather maps. We now proceed to investigate this correlation further by means of the composite portrait method. This method is a device to bring out more clearly the general systems of the winds by throwing together on to one sheet a large number of wind arrows in their proper position with reference to the controlling center of low pressure. In this way we have many more observations to help us in our investigation than if we used only those which are given on one weather map, and the circulation can be much more clearly made out.
Provide yourself with a sheet of tracing paper, prepared as described in Chapter XI. Place the paper over an area of low pressure on some weather map, with the dot at the center of the low, and having the paper properly oriented, as already explained. Trace off all the wind arrows around the center of low pressure, making the lengths of these arrows roughly proportionate (by eye) to the velocity of the wind, according to some scale previously determined upon. Include on your tracing all the wind arrows reported at stations whose lines of pressure-decrease converge towards the low pressure center. Repeat this operation, using other centers of low pressure on other maps, until the number of arrows on the tracing paper is so great that the composite begins to become confused. Be careful always to center and orient your tracing paper properly. Select the weather maps from which you take your wind arrows so that the composite shall properly represent winds in all parts of the cyclonic area.
Deduce a general rule for the circulation and velocity of the wind in a cyclonic area, as shown on your tracing, and write it out.
B. Anticyclones.—This exercise is done in precisely the same way as the preceding one, except that anticyclones and their winds are studied instead of cyclones.
Deduce a general rule for the circulation and velocity of the wind in an anticyclonic area, as shown on your tracing, and write it out.
The control of the wind circulation by areas of low and high pressure is one of the most important laws in meteorology. Buys-Ballot, a Dutch meteorologist, first called attention to the importance of this law in Europe, and it has ever since been known by his name. Buys-Ballot’s Law is generally stated as follows: Stand with your back to the wind, and the barometer will be lower on your left hand than on your right.4 This statement, as will be seen, covers both cyclonic and anticyclonic systems. The circulations shown on your tracings hold everywhere in the Northern Hemisphere, not only around the areas of low and high pressure seen on the United States weather maps, but around those which are found in Europe and Asia, and over the oceans as well. Mention has already been made, in the chapter on isobars (VII), of the occurrence of immense cyclonic and anticyclonic areas, covering the greater portion of a continent or an ocean, and lasting for months at a time. These great cyclones and anticyclones have the same systems of winds around them that the smaller areas, with similar characteristics, have on our weather maps. A further extension of what has just been learned will show that if in any region there comes a change from low pressure to high pressure, or vice versa, the system of winds in that region will also change. Many such changes of pressures and winds actually occur in different parts of the world, and are of great importance in controlling the climate. The best-known and the most-marked of all these changes occurs in the case of India. During the winter, an anticyclonic area of high pressure is central over the continent of Asia. The winds blow out from it on all sides, thus causing general northeasterly winds over the greater portion of India. These winds are prevailingly dry and clear, and the weather during the time they blow is fine. India then has its dry season. As the summer comes on, the pressure over Asia changes, becoming low; a cyclonic area replaces the winter anticyclone, and inflowing winds take the place of the outflowing ones of the winter. The summer winds cross India from a general southwesterly direction, come from over the ocean, and are moist and rainy. India then has its rainy season. These seasonal winds are known as Monsoons, a name derived from the Arabic and meaning seasonal.
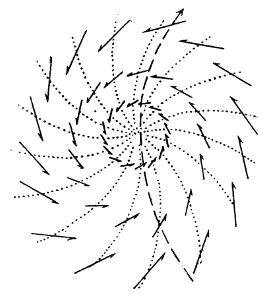
Fig. 48.
The accompanying figure (Fig. 48) is taken from the Pilot Chart of the North Atlantic Ocean, published by the Hydrographic Office of the United States Navy for the use of seamen. It shows the wind circulation around the center of a cyclone which is moving northward along the Atlantic Coast of the United States. The long arrow indicates the path of movement; the shorter arrows indicate the directions of the winds. By means of such a diagram as this a captain is able to calculate, with a considerable degree of accuracy, the position of the center of the cyclone, and can often avoid the violent winds near that center by sailing away from it, or by “lying to,” as it is called, and waiting until the center passes by him at a safe distance. These cyclones which come up the eastern coast of the United States at certain seasons are usually violent, and often do considerable damage to shipping. The Weather Bureau gives all the warning possible of the coming of these hurricanes, as they are called, by displaying hurricane signals along the coast, and by issuing telegraphic warnings to newspapers. In this way ship captains, knowing of the approach of gales dangerous to navigation, may keep their vessels in port until all danger is past. Millions of dollars’ worth of property and hundreds of lives have thus been saved.
CHAPTER XIII.
CORRELATION OF THE DIRECTION OF THE WIND AND THE TEMPERATURE
It is evident, from even the most general observation of the weather elements, that the temperature experienced at any place is very largely dependent upon the direction of the wind. Thus, for instance, in the United States, a wind from some northerly point is likely to bring a lower temperature than a southerly wind. To investigate this matter more closely, and to discover how the winds at any station during any month are related to the temperatures noted at that station, we proceed as follows:—
Select the Weather Bureau station at which you wish to study these conditions. Note the direction of the wind and the temperature at that station on the first day of any month. Prepare a table similar to the following one.
Table III.—Correlation of the Direction of the Wind and the Temperature.
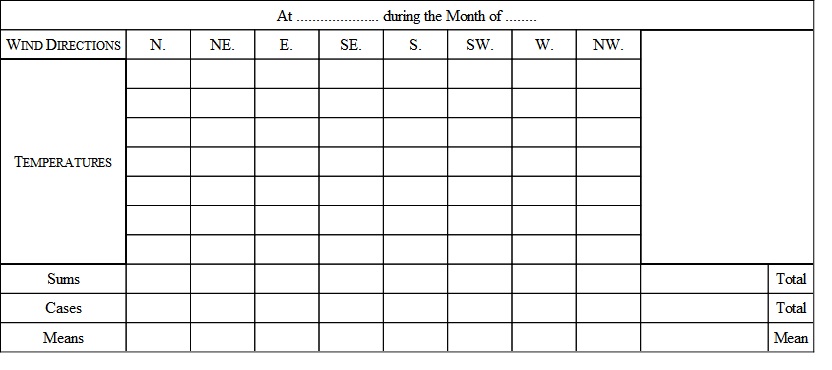
Enter the temperature at 8 A.M. on the first day of the month in a column of the table under the proper wind direction. Thus, if the wind is NE., and the temperature 42°, enter 42 in the second column of the table. Repeat the observation for the same station, and for all the other days of the month, recording the temperatures in each case in their appropriate columns in the table. Omit all cases in which the wind is light, because winds of low velocities are apt to be considerably affected by local influences. When the observations for the whole month have been entered in the table, add up all the temperatures in each column (sums). Find the mean temperature (means) observed with each wind direction by dividing the sums by the number of observations in each column (cases). Add all the sums together; divide by the total number of cases, and the result will be the mean temperature5 for the month at the station. The general effect of the different wind directions upon the temperature is shown by a comparison of the means derived from each column with the mean for the month.
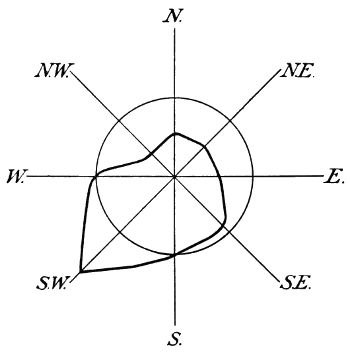
Fig. 49.
A graphic representation of the results of this investigation will help to emphasize the lesson. Draw, as in the accompanying figure (Fig. 49), eight lines from a central point, each line to represent one of the eight wind directions. About the central point describe a circle, the length of whose radius shall correspond to the mean temperature of the month, measured on some convenient scale. Thus, if the mean temperature of the month is 55° and a scale of half an inch is taken to correspond to 10° of temperature, the radius of the circle must be five and a half times half an inch, or 23⁄4 inches. Next lay off on the eight wind lines the mean temperatures corresponding to the eight different wind directions, using the same scale (1⁄2 in. = 10°) as in the previous case. Join the points thus laid off by a heavy line, as shown in Fig. 49. The figure, when completed, gives at a glance a general idea of the control exercised by the winds over the temperatures at the station selected. Where the heavy line crosses a wind line inside the circle it shows that the average temperature accompanying the corresponding wind direction is below the mean. When the heavy line crosses any wind line outside the circle, it shows that the average temperature accompanying the corresponding wind direction is above the mean. Such a figure is known as a wind rose.
The cold wave and the sirocco are two winds which exercise marked controls over the temperature at stations in the central and eastern United States. The cold wave has already been described in Chapter V. It is a characteristic feature of our winter weather. It blows down from our Northwestern States or from the Canadian Northwest, on the western side of a cyclone. It usually causes sudden and marked falls in temperature, sometimes amounting to as much as 50° in 24 hours. The sirocco is a southerly or southwesterly wind. It also blows into a cyclone, but on its southern or southeastern side. Coming from warmer latitudes, and from over warm ocean waters, the sirocco is usually a warm wind, in marked contrast to the cold wave. In winter, in the Mississippi Valley and on the Atlantic Coast, the sirocco is usually accompanied by warm, damp, cloudy, and snowy or rainy weather. The high temperatures accompanying it (they may be as high as 50° or 60° even in midwinter) are very disagreeable. Our warm houses and our winter clothing become oppressive and we long for the bright, crisp, cold weather brought by the cold wave. In summer when a sirocco blows we have our hottest spells. Then sunstrokes and prostrations by the heat are most common, and our highest temperatures are recorded. The word sirocco (from Syriacus=Syrian) was first used as the name of a warm southerly wind in Italy. The cause and the characteristics of the Italian sirocco and of the American sirocco are similar, and the name may therefore be applied to our wind as well as to the Italian one. In the Southern Hemisphere, at Buenos Ayres, Argentine Republic, there is a similar contrast between two different winds. The pampero is similar in many respects to our cold wave. It is a dry, cool, and refreshing wind, blowing over the vast level stretches of the Argentine pampas from the southwest. The norte is a warm, damp, depressing northerly wind corresponding to our sirocco.