 полная версия
Позитивные изменения, Том 3 №1, 2023. Positive changes. Volume 3, Issue 1 (2023)
В бухгалтерском балансе прибыль отражается по строке 2300.
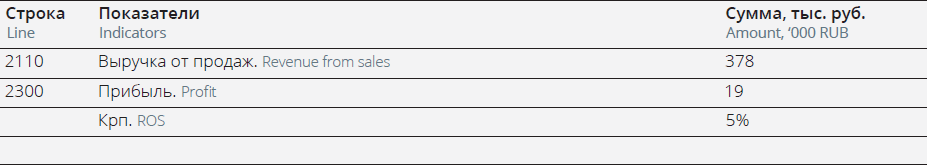
Выручка от продаж (Врч) – сумма денег, полученная предприятием при реализации товаров и услуг за период. Определяется как объем проданных товаров и услуг, умноженный на цену их продажи.
В бухгалтерском балансе выручка отражается в строке 2110.
Суть коэффициента рентабельности состоит в том, что он комплексно отражает степень эффективности использования материальных, трудовых и денежных ресурсов. Снижение рентабельности отражает сокращение объёмов продаж или демонстрирует неэффективность хозяйственной деятельности. Если предприятие продает различные виды товаров и услуг, то выручка суммируется по видам товаров и услуг.
НОРМАТИВНЫЕ ЗНАЧЕНИЯ:В среднем можно ориентироваться на такие значения:
• 1–5 % – низкий показатель, необходимо принимать меры для повышения рентабельности;
• 5–20 % – средний показатель, компания способна работать стабильно;
• 20–30 % – высокая экономическая эффективность деятельности.
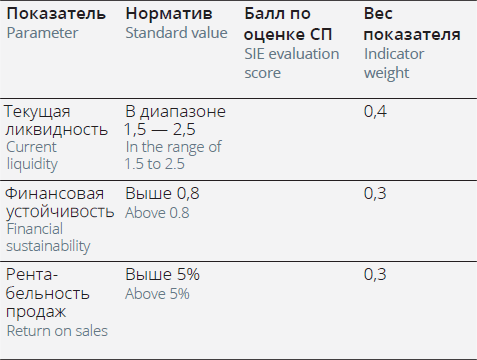
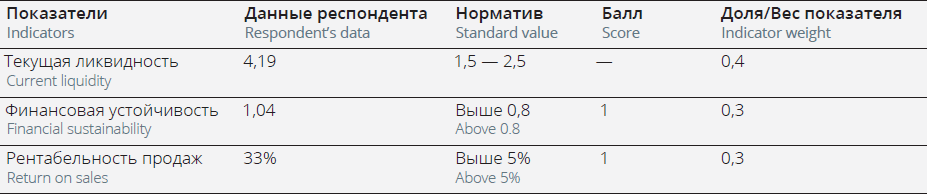
РАСЧЕТ ФИНАНСОВОГО РЕЙТИНГА ОРГАНИЗАЦИИЗаполняем таблицу показателей финансового состояния социального предприятия (СП) (1 балл при соответствии, 0 баллов при несоответствии нормативу), см. Таблица 4.
Таблица 4. Показатели финансового состояния социального предприятия
При расчете первых двух показателей у социального предприятия может возникнуть ситуация, когда в знаменатель попадает нулевое значение. И на практике при консультировании социальных предпринимателей мы сталкивались с подобным обстоятельством.
Такая ситуация при расчете текущей ликвидности может оказаться при отсутствии краткосрочных обязательств, а при расчете коэффициента финансовой устойчивости – при отсутствии заемных средств. И тут в сравнении с чистой бизнес-моделью для социального предприятия мы должны сделать некое исключение из общих правил.
Для стандартной бизнес-модели наличие краткосрочных обязательств и займов говорит о расширении задействованного финансового ресурса через использование денег партнеров или банков, что является правильным решением для развития бизнеса. В случае же социального предприятия извлечение максимальной прибыли за счет привлечения кредитных денег не является ключевым. Ключевым является наличие ресурса для своей социальной миссии.
Если в знаменателе показатели текущей ликвидности и финансовой устойчивости равны нулю, то для социальных предпринимателей принято решение засчитывать данные показатели как удовлетворяющие нормативу. По этим показателям присваивается балл, равный единице. Это справедливо с точки зрения финансового смысла. Текущая ликвидность в нормативе – значит у предприятия нет сложностей с оплатой своих обязательств (обязательства оплачены и равны нулю). Финансовая устойчивость в нормативе – у предприятия в структуре капитала только собственные средства, нет рисков невыплат займов.
Далее вычисляем итоговый коэффициент по формуле:
S = 0,4 * Балл Ктл + 0,3 * Балл Кфу + 0,3 * Балл Крп
На основе расчета итогового показателя экономической устойчивости предприятия можно разделить на 3 класса с точки зрения выдачи субсидий:
• первоклассные – субсидирование которых не вызывает сомнений;
• второго класса – субсидирование требует взвешенного подхода;
• третьего класса – субсидирование связано с повышенным риском.
Сумма баллов S влияет на рейтинг организации:
Диапазон 0,7–1,0 – СП первого класса экономической устойчивости;
Диапазон 0,4–0,6 – СП второго класса экономической устойчивости;
Менее 0,4 – СП третьего класса экономической устойчивости.
Для повышения устойчивости анализируем, какие показатели дали сниженные баллы, на какие мы готовы повлиять в течение ближайшего отчетного периода.
Хорошей компенсацией низкого показателя экономической устойчивости (либо его отсутствия) может быть качественно разработанная теория изменений для показателей, участвующих в оценке.
РЕШАЕМ КЕЙСЫРазберем применение данной оценки на примере организаций, проходящих консультирование в рамках запуска методики. Данные бухгалтерского баланса, приведенные ниже, смоделированы относительно реальных данных организаций, но показывают фактические соотношения показателей.
КЕЙС № 1Организация несколько лет занимается производством и продажей изделий для людей с ОВЗ, планируется расширение бизнеса, но инвестиций в расширение пока не вложено.
По данным бухгалтерского баланса рассчитываем три коэффициента (см. Таблицы 5, 6, 7).
Таблица 5. Коэффициент текущей ликвидности
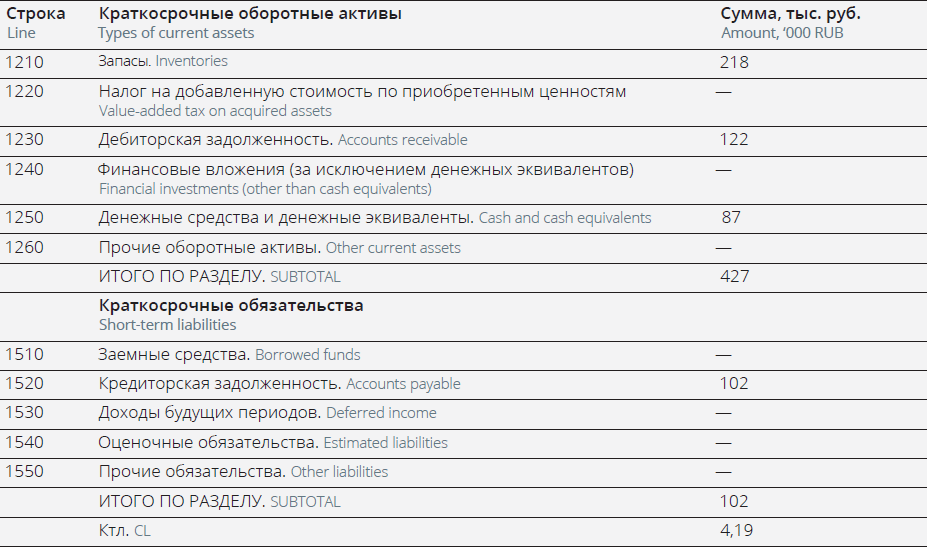
Таблица 6. Коэффициент финансовой устойчивости
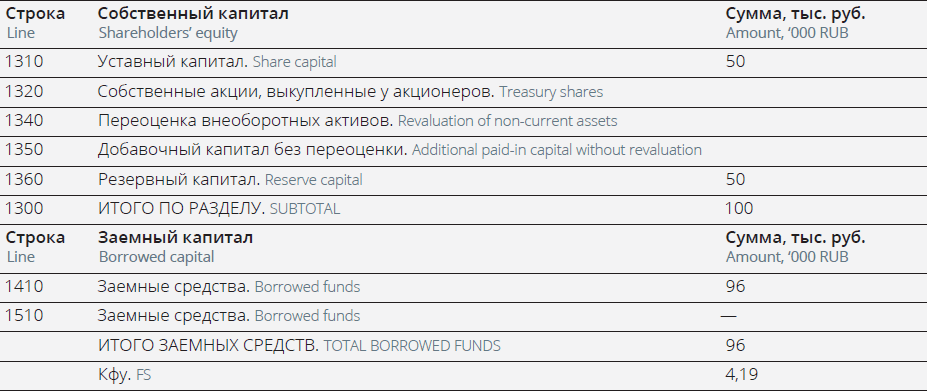
Таблица 7. Коэффициент рентабельности продаж
По коэффициентам определяем итоговые баллы и рассчитываем коэффициент экономической устойчивости (см. Таблица 8).
Таблица 8. Рассчитанный коэффициент экономической устойчивости
S = 0,4 * Балл Ктл + 0,3* Балл Кфу + 0,3 * Балл Крп = 0,4 * 0 + 0,3 * 1 + 0,3 * 1 = 0,6
Выводы по рассчитанному коэффициенту экономической устойчивости:
Текущая ликвидность выходит за границы нормативных значений, коэффициент превышает верхнюю границу из-за объема запасов (большой объем готовой продукции и материалов для производства). Это излишне замораживает средства. Для улучшения показателя необходимо более эффективно управлять запасами, рекомендуется сократить их минимум в два раза. Косвенной предпосылкой высоких запасов может быть планируемое расширение бизнеса, но необходимо в этом убедиться. Если «сверхзапас» возник по единовременному управленческому решению, то динамика следующих периодов приведет коэффициент текущей ликвидности в норматив за счет увеличения оборота.
Компания попадает во второй класс экономической устойчивости (S = 0,6), для увеличения рейтинга нужен конкретный план действий по улучшению текущей ликвидности.
КЕЙС № 2Организация открыла в 2022 году вторую площадку, на которой люди с ОВЗ предоставляют услуги. Первая существует уже несколько лет и успешна. Во вторую площадку были большие финансовые вложения в начале года – на ремонт и оборудование помещения. Ее открытие состоялось ближе к концу года.
По данным бухгалтерского баланса за 2022 год рассчитываем три коэффициента (см. Таблица 9, 10, 11).
Таблица 9. Коэффициент текущей ликвидности
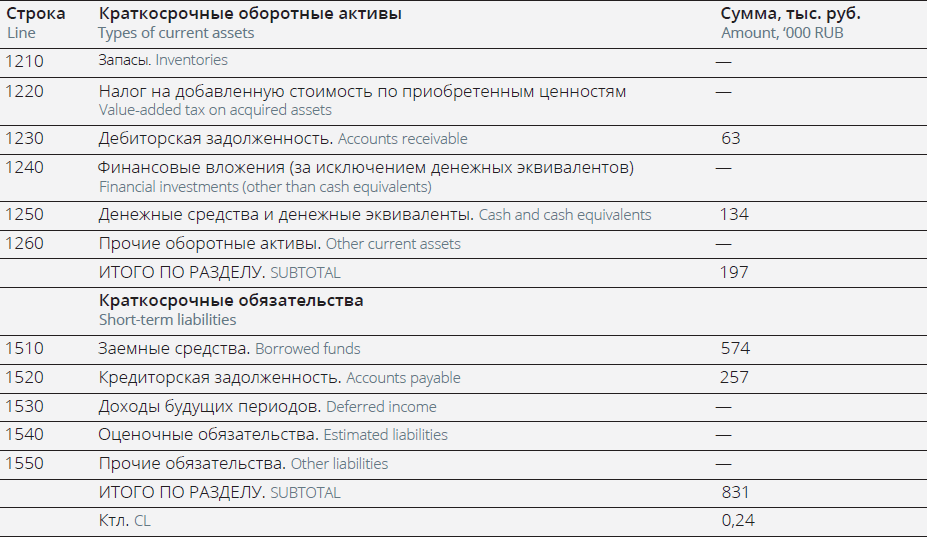
Таблица 10. Коэффициент финансовой устойчивости

Таблица 11. Коэффициент рентабельности продаж
По коэффициентам определяем итоговые баллы и рассчитываем коэффициент экономической устойчивости (см. Таблица 12).
Таблица 12. Рассчитанный коэффициент экономической устойчивости

S = 0,4 * Балл Ктл + 0,3 * Балл Кфу + 0,3 * Балл Крп = 0,4 * 0 + 0,3 * 0 + 0,3 * 1 = 0,3
Выводы по рассчитанному коэффициенту экономической устойчивости:
Текущая ликвидность выходит за границы нормативных значений, коэффициент ниже первой границы из-за превышения обязательств над активами. Компания взяла кредит на открытие второго офиса, и текущее финансовое положении обязывает компанию изыскать средства на погашение долговых обязательств, которые действительно являются риском для социального предприятия, так как ремонт офиса неожиданно затянулся и запуск пришлось отложить. Для улучшения показателя необходим эффективный запуск второго офиса. По той же причине за границы нормативных значений выходит финансовая устойчивость, так как заемные средства превышают собственный капитал.
Компания попадает в третий класс экономической устойчивости (S = 0,3), для увеличения рейтинга нужен конкретный план действий по сокращению задолженности.
КЕЙС № 3Организация работает несколько лет, развивая туристический бизнес для людей уязвимой социальной категории. Помимо грантов, позволяющих наполнять поездки дополнительным социальным контекстом, большая часть дохода строится на продаже услуг.
По данным бухгалтерского баланса рассчитываем три коэффициента (см. Таблица 13, 14, 15).
Таблица 13. Коэффициент текущей ликвидности.
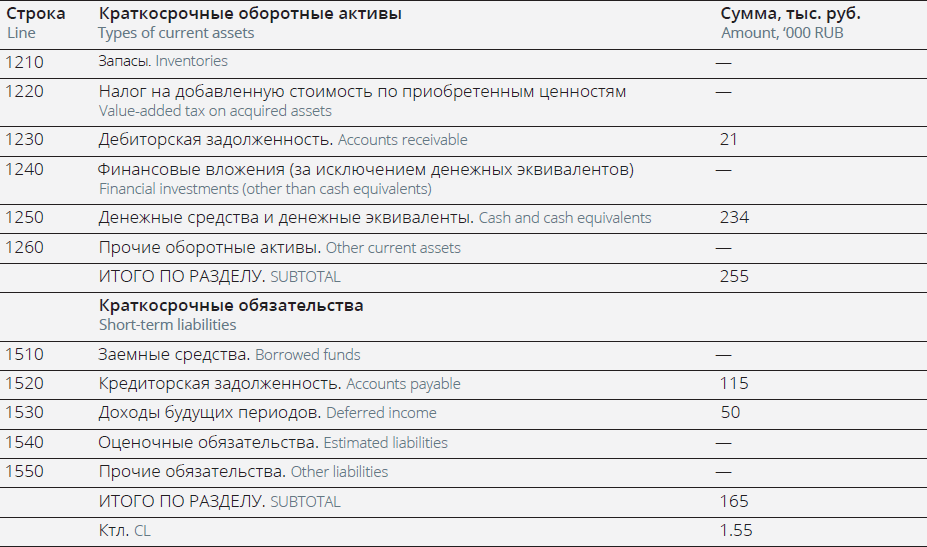
Таблица 14. Коэффициент финансовой устойчивости.
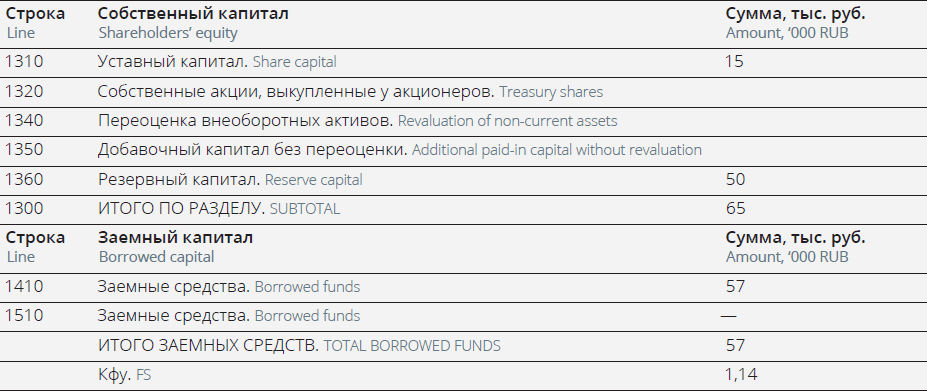
Таблица 15. Коэффициент рентабельности продаж.
По коэффициентам определяем итоговые баллы и рассчитываем коэффициент экономической устойчивости (см. Таблица 16).
Таблица 16. Рассчитанный коэффициент экономической устойчивости
S = 0,4 * Балл Ктл + 0,3 * Балл Кфу + 0,3 * Балл Крп = 0,4 * 1 + 0,3 * 1 + 0,3 * 1 = 1
Выводы по рассчитанному коэффициенту экономической устойчивости:
Все коэффициенты находятся в пределах нормативных значений. Компания в текущем периоде попадает в первый класс экономической устойчивости (S = 1).
ОБЛАСТЬ ПРИМЕНЕНИЯ МЕТОДИКИВ случае самооценки данная методика рекомендована к применению в первую очередь социальным предпринимателям на любой стадии развития организации. Она позволит понять стабильность их экономического положения и его изменение с течением времени. Методика является подспорьем для выработки решений, укрепляющих экономику предприятия. Также данные коэффициенты для самооценки могут использовать и любые коммерческие организации как базовую часть финансового анализа их бизнеса.
С другой стороны, данную методику могут применять грантодающие организации для оценки потенциала участников конкурса грантов, с использованием процедуры экспертного оценивания. Запрос данных по бухгалтерскому балансу позволит выбрать более устойчивые экономически организации на предварительном этапе и сократить риски реализации проекта по экономическим причинам. Безусловно, оцениваться полноценно могут только заявители, имеющие бизнес-модель в своей деятельности. В случае некоммерческих организаций, не имеющих в своей структуре деятельности бизнес-модели, данная оценка не применима.
The Union of Business and Money. Evaluation of the Economic Sustainability of Social Entrepreneurship Projects
Elena Avramenko
DOI 10.55140/2782–5817–2023–3–1–44–57

In the fall of 2022, the Social Projects Support Fund commissioned the development of a model for evaluating the impact of social entrepreneurship projects. An expert group of the model authors from the Positive Changes Factory, the Gladway Foundation, and other organizations suggested including an “economic sustainability” component alongside “social impact” and “relevance of the problem addressed.” Ten social enterprises participated in testing the model. In this material, we will present the essence of the evaluation of economic sustainability of the projects proposed under the model developed, and why its methodology can aid in making the right decisions.

Elena Avramenko
Expert of the project “Development of a Social and Economic Impact Assessment Model for NGOs” by the GLADWAY Foundation, Lean 6 Sigma Green Belt master
A HARMONIOUS UNION
Social entrepreneurship should ideally be a harmonious union between an effective solution to an important social problem and a sustainable business model. An organization can only manage change and make a positive impact on the society if it has constant and reliable financial resources. In light of this, financial analysis of your commercial activities is an important components of success. By looking at the dynamics of financial performance from year to year, a company can understand the strengths and weaknesses of its management, and therefore can plan and improve performance over time. That is why the experts decided to add an economic sustainability indicator to the model being developed.
The need to evaluate economic sustainability and financial performance of a social enterprise is evidenced by the success stories of Western companies offering social impact consultancy services (see Figure 1). For example, JBJ Consult (Switzerland) provides evaluation of profitability, self-sufficiency, return on investment and other financial indicators, making sure their clients’ businesses yield both financial and social return. Another example is the Monitor Institute by Deloitte, which works with social impact organizations to improve their impact and managerial performance, and to optimize resource utilization.
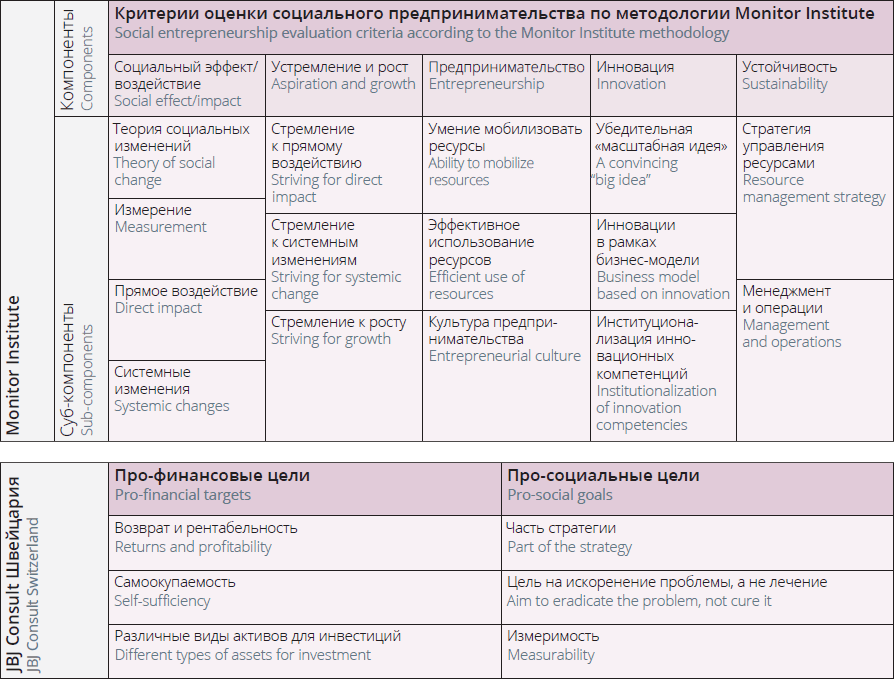
Figure 1. The Use of Economic Indicators in Evaluating Social Entrepreneurship in Western Countries (Based on Evolution & Philanthropy Research Organization)1
* – relevant for institutional investors who want to start with a pilot, to assess risk
THREE KEY INDICATORS
The economic stability indicator formula is based on the principle of accessibility and unambiguity of the data used: when compiling the evaluation model, the authors indicated specific locations in the accounting balance sheet where the respective indicators can be obtained. Therefore, it is no longer necessary to describe the economic component in terms of risks and in the context of investment, as suggested by SROI and IMP methodologies. These methodologies require using not just accounting, but econometric analysis methods, which may not be available to a wide range of social entrepreneurs. The scale and scope of most social entrepreneurship projects does not require hiring an expert in computational methods in economics and/or the social sciences.
That is why easily accessible indicators were chosen for this model, which reflect the economic effectiveness component of the social enterprise, and which every enterprise can calculate without going too deep into complex analysis methods.[34]
The proposed evaluation of the organization’s financial condition uses such ratios as current liquidity, financial sustainability and return on sales, based on figures that can be found in the standard accounting statements.
1. Current liquidity shows whether the organization has enough working capital to cover its current liabilities as they fall due.
2. Financial sustainability shows the degree of the organization’s dependence on external funding and helps predict its solvency in the long run.
3. Return on sales is a comprehensive measure of the efficiency of material, labor and monetary resources utilization. A decrease in this figure means either a decrease in sales or inefficiency of economic activity.
These three indicators were chosen in the methodology as the key to analyzing the financial performance of the social enterprise, demonstrating how efficiently it is managed economically over several aspects. Current liquidity shows financial reliability and sustainability of the organization in the short run (ability to pay bills within a year). The financial sustainability ratio shows the capital structure – this indicator describes long-term financial reliability and the ability to meet its obligations in the long run. It is important for a social enterprise not to become overly indebted. Return on sales shows managerial efficiency, proper estimation of revenues and expenditures and cost control.
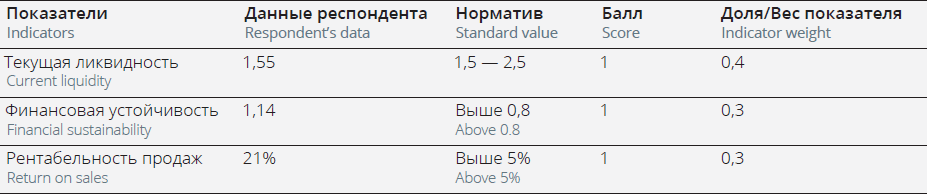
The influence of each indicator on the final score is based on the assigned weight (see Figure 2):
Current liquidity – 0.4;
Financial sustainability – 0.3;
Return on sales – 0.3.
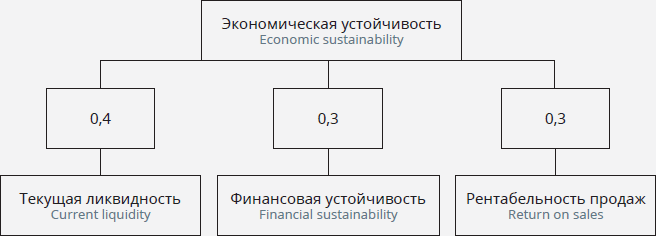
Figure 2. Indicator weights in calculating economic sustainability
The weight ratios between the three indicators are close, but the current liquidity is given a somewhat larger weight. The standard level of the current liquidity ratio means the organization has a reliable financial position in the current year, and therefore can improve the other two indicators for the year. If, however, the organization cannot cover its liabilities in the current year, the prospect of long-term reliability and efficient distribution of current revenues and expenditures does not warrant complete protection against the bankruptcy risks.
The final formula for the economic sustainability indicator is obtained as a weighted total of current liquidity, financial sustainability and return on sales according to the following formula:
Economic stability = 0.4 * Current liquidity + 0.3 * Financial sustainability + 0.3 * Return on sales
INDICATOR FORMULAS AND DEFINITIONS1. Current Liquidity (CL) is the ratio of the value of short-term assets (STA) to the value of short-term liabilities (STL) of the social enterprise.
CL = STA / STL
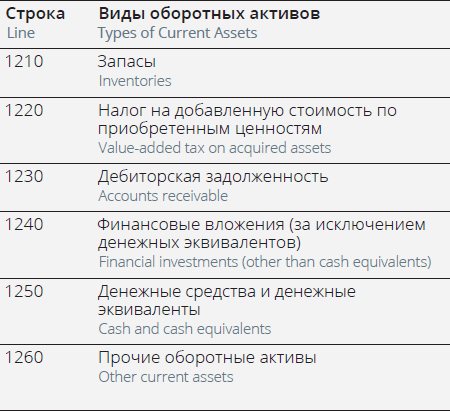
Short-Term Assets (STA) are company property, receivables, and other items that are involved in income generation: for example, cash in bank and on hand, accounts receivable, inventories, raw materials, deposits in banks, stocks and bonds of other companies. Short-term assets are consumed or sold in less than a year.
In the balance sheet form, short-term assets are reflected in the following lines (see Table 1).
Table 1. Types of current assets in the balance sheet form
Short-Term Liabilities (STL) are debt obligations of the enterprise maturing within one year. Short-term liabilities of the organization include: accounts payable (short-term obligations to pay suppliers for the goods delivered, obligations to buyers in case of down payment for products, obligations to other creditors), short-term bank loans, taxes and wages payable.
In the balance sheet form, short-term liabilities are reflected in the following lines (see Table 2).
Table 2. Short-term liabilities in the balance sheet form
The essence of the Current Liquidity ratio is that it allows you to determine whether the organization has enough working capital to cover its current liabilities as they fall due. The CL indicator helps evaluate the organization’s solvency.
STANDARD INDICATORS:The standard optimal value of CL is in the range from 1.5 to 2.5, depending on the industry. The current liquidity ratio of 3 and above indicates an unreasonable capital structure and slower turnover of funds invested in inventories.
2. Financial sustainability (FS) is the ratio of Shareholders’ Equity (SE) to liabilities on Borrowed Funds (BF).
FS = SE / BF
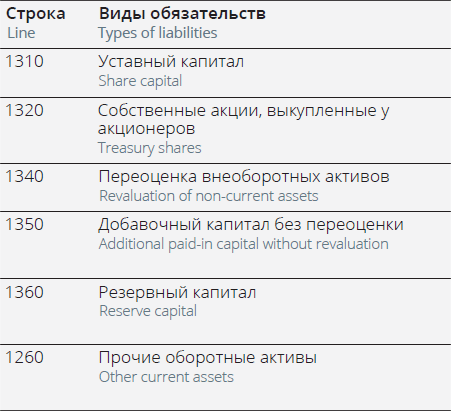
Shareholders’ Equity (SE) is the value of all non-monetary and monetary property owned by the company, less the value of all its outstanding liabilities.
The shareholders’ equity is calculated using a simple method: just take the sum total of line 1300 of the balance sheet.
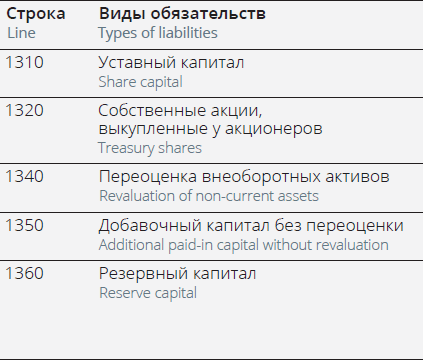
Detailed breakdown of the shareholders’ equity is given in the balance sheet in the following lines (see Table 3).
Table 3. Shareholders’ equity in the balance sheet
Borrowed funds (BF) are the property and money of third parties raised by the company for a certain period of time for use in its activities, subject to a payment of interest.
In the balance sheet, there are two lines reflecting borrowed funds: line 1410 “Borrowed funds” and line 1510 of the same name.
The essence of the Financial Sustainability ratio is that it shows the degree of dependence of the organization on external funding and helps predict its solvency in the long run.
STANDARD VALUES:The standard value for the ratio is considered to be above 0.8.
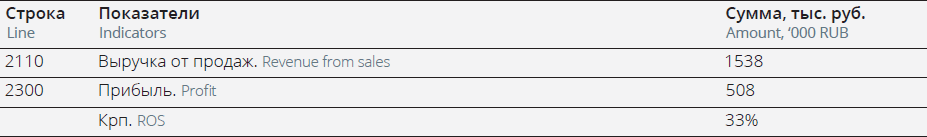
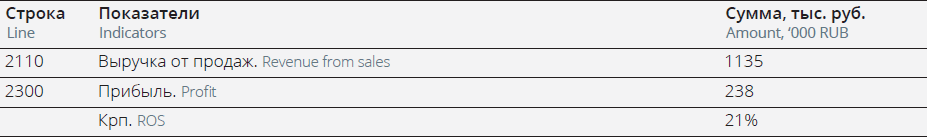
3. Return on sales (ROS) is the ratio of profit (P) to Sales Revenue (SR). The figure needs to be multiplied by 100 to convert to percentage.
ROS = P / SR * 100 %
Profit (P) is the positive difference between the total revenue (which includes revenue from the sale of goods and services, fines and compensation received, interest income, etc.) and the costs of production or purchase of goods, storage, transportation, sales of the organization’s goods and services. Profit = Revenue – Expenditure (in monetary terms).
In the balance sheet, profit is shown on line 2300.
Sales Revenue (SR) is the amount of money received by the enterprise when selling goods and services for the period. It is defined as the volume of goods and services sold multiplied by their selling price.
In the balance sheet, revenue can be found in line 2110.
The essence of the Return on Sales ratio is that it comprehensively reflects the efficiency of material, labor and monetary resources utilization. A decrease in ROS means either a decrease in sales or inefficiency of economic activity. If an enterprise sells different types of goods and services, then the revenue is summed up by type of goods and services.
STANDARD VALUES:On average, you can be guided by these values:
• 1–5 % is a low indicator; measures must be taken to improve return on sales;
• 5–20 % is the average, the company is able to maintain stable operation;
• 20–30 % is high economic efficiency of activity.
CALCULATION OF AN ORGANIZATION’S FINANCIAL RATINGFill in the table with figures indicating the financial condition of the social impact enterprise (SIE) (1 point for compliance, 0 points for non-compliance with the standard), see Table 4.
Table 4. Figures indicating the financial condition of the social impact enterprise (SIE)

When calculating the first two ratios, a social impact enterprise may find itself in a situation where the denominator is zero. We have encountered this situation in practice when consulting social entrepreneurs.
This situation may occur in the calculation of Current Liquidity ratio in absence of short-term liabilities, and in calculating the Financial Sustainability ratio – in absence of borrowed funds. And here, compared to a pure business model for a social enterprise, we have to make an exception from the general rules.
In the standard business model, the existence of short-term liabilities and loans indicates the expansion of the financial resource raised, through the use of money provided by partners or banks, which is considered the right decision for business development. In the case of a social enterprise, however, maximizing profits by borrowing funds is not the key. The key is to have the resources for pursuing one’s social mission.