

 полная версия
Practical Exercises in Elementary Meteorology
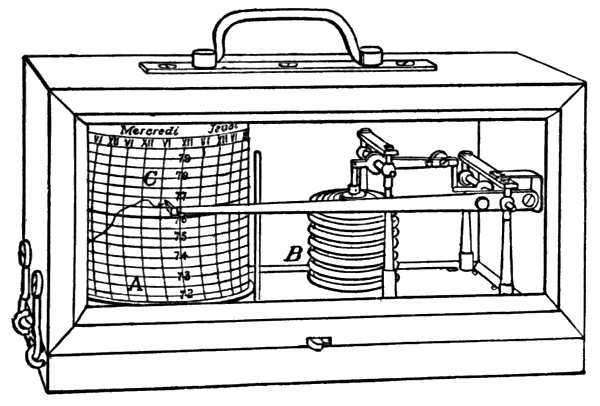
Fig. 13.
Barograph records are fully as interesting as those made by the thermograph. The week’s record traced on the writer’s barograph during a winter voyage from Punta Arenas, Strait of Magellan, to Corral, Chile, Aug. 2-9, 1897, gives a striking picture of the rapid and marked changes of pressure during seven days in the South Pacific Ocean (Fig. 14).
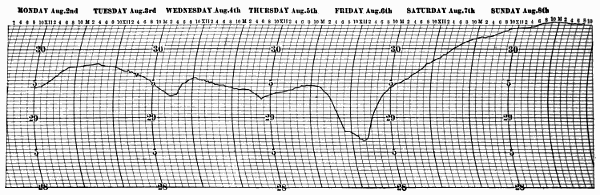
Fig. 14.
The following figure (Fig. 15) presents samples of barograph curves traced at Harvard College Observatory, Cambridge, Mass., during Feb. 22-28, 1887, and May 17-23, 1887. The February curve illustrates well the large and irregular fluctuations in pressure, characteristic of our winter months; while the May curve shows clearly the more even quality of the pressure changes in our summer.
The anemometer shown in Fig. 16 is the most generally used of instruments designed to measure wind velocity. It is known as the Robinson cup anemometer, and consists of four hollow hemispherical cups upon arms crossed at right angles, and all facing the same way around the circle. The cross-arms are fixed upon a vertical axis having an endless screw at its lower end. When the cups move around, the endless screw turns two dials which register the number of miles traveled by the wind. The Weather Bureau pattern of anemometer has the dials mounted concentrically, the outer dial having 100, and the inner, 99 divisions. The revolutions of the outer dial are recorded on the inner one, and in making an observation of the number of miles traveled by the wind, the hundreds and tens of miles are taken from the inner dial, and the miles and tenths from the outer one. Take from the inner scale the hundreds and tens of miles contained between the zero of that scale and the zero of the outer one. Take on the outer scale the miles and tenths of miles contained between the zero of that scale and the index point of the instrument. The sum of these readings is the reading of the instrument at the time of the observation.
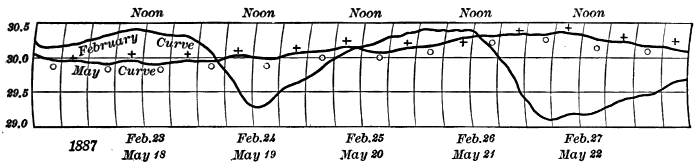
Fig. 15.
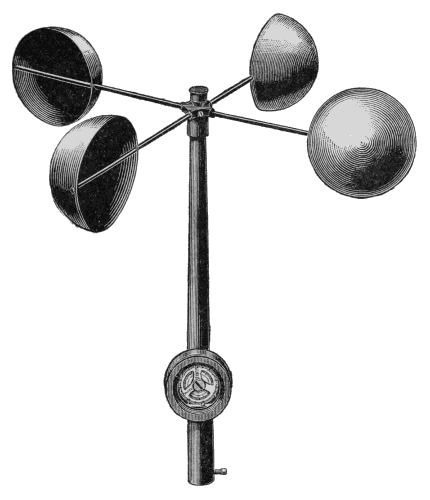
Fig. 16.
Wind velocities are recorded in miles per hour. The velocity of the wind at any particular moment is found by noting the number of miles and tenths of miles recorded by the index before and after an interval of one minute, or of five minutes, and multiplying this rate by 60 or by 12 as the case may be. This gives the number of miles an hour that the wind is blowing at the time of observation.
Records of wind velocity (in miles per hour) are to be made at each regular observation hour, and are to be entered in the proper column of the table in your record book. The total wind movement in each 24 hours is to be observed once a day, always at the same hour, and is to be entered in its proper column in the record book.
The total wind movement for 24 hours is obtained as follows: Subtract the reading of the anemometer at 12 noon (or 8 A.M., or any other hour) of the preceding day from the reading taken at 12 noon or the corresponding hour of the current day, and the difference will be the total movement of the wind. When the reading of the anemometer is less than the reading of the preceding day, 990 miles should be added to it; and the remainder, after subtracting the reading of the preceding day, will be the total wind movement for the 24 hours. Thus: To-day’s reading = 91 miles; yesterday’s reading = 950 miles. Hence 91 + 990 = 1081 miles, 1081 – 950 = 131 miles = total wind movement for the current day.
By means of an electrical attachment the anemometer may be arranged so as to record continuously on a cylinder rotating by clock-work, a pen making a mark on the paper for every mile traveled by the wind. The anemometer should be exposed on top of a building where there is as little obstruction as possible by tall chimneys, higher buildings, and the like.
The nephoscope (Greek: cloud observer) is an instrument used in determining the directions of movement of clouds. These directions, if determined by ordinary eye observation of the clouds as they drift across the sky, are apt to be quite inaccurate. The best method of observing directions of cloud movement is to note the path of the reflection of the cloud in a horizontal mirror, the observer looking at this reflection through an eyepiece which remains fixed during the operation. Such a horizontal mirror, adapted to measure the direction of motion of clouds, is known as a nephoscope. A form of nephoscope devised by Mr. H. H. Clayton, of Blue Hill Observatory, Hyde Park, Mass., is shown in Fig. 17.
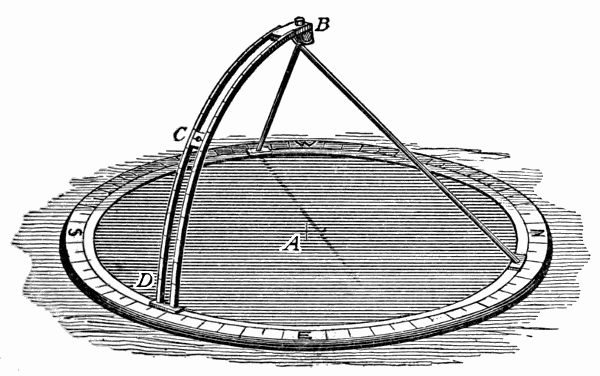
Fig. 17.
This instrument consists of a circular mirror, 13 inches in diameter, sunk in a narrow circular wooden frame, on top of which is fastened a brass circle, S.W.N.E., divided to 5° of arc. Inside of this fixed circle is a movable brass one, to which is attached a brass arc, BD, rising above the mirror and bearing a movable eyepiece, C. This arc forms the quadrant of a circle whose center is the center of the mirror, and is divided to 5° of arc. Its top is held vertically over the center of the mirror by two rods fastened to the movable circle. The center of the mirror A is marked by cross lines on the reflecting surface, the glass of which is thin. In order to determine the motion of a cloud, the movable circle and tripod are revolved until the arc BD is in the vertical plane formed by the cloud, the center of the mirror, and the eye. The eyepiece C is then shifted until some point of the cloud image, as seen through the eyepiece, is projected on the intersection of the cross lines on the glass. The cloud image soon changes its position, and while the eye is still held at the eyepiece, a small index is placed on the part of the cloud image which previously appeared on the center of the mirror. If now a ruler be placed on the index and the center of the mirror and extended backward, its intersection with the divided scale will give the direction from which the cloud came to the nearest degree, if all the measurements have been accurately made. The height of the cloud above the horizon is found by reading the position of the eyepiece on the divided quadrant.
The nephoscope may be placed on a table, out of doors in fine weather, or close to a window from which the clouds to be observed can be seen. The instrument must be properly oriented, so that the four points marked N., E., S., and W. on the frame shall correspond to the four chief compass directions. The zero (0°) of the movable brass scale is usually put at the S. Hence, if a cloud is found moving from exactly SW., the angular measurement of its direction of motion will be 45°. If a cloud is moving from due E., the angular measurement of its direction of motion will be 270°.
When the sky is completely overcast with a uniform layer of cloud, it is usually impossible to determine any direction of movement, because of the difficulty of selecting and keeping in view, on the mirror, some particular point of cloud.
Observations with the nephoscope may be made as often as is desired, and should be entered in an appropriate column in the record book.
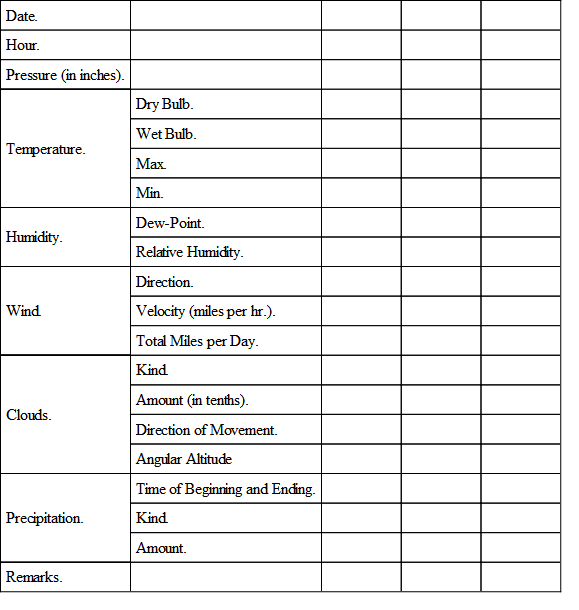
Tabulation of Observations.—A convenient form of table which may be used in the complete instrumental observations is given on the next page. The number of columns and their arrangement may, of course, be varied to suit the number and the nature of the records.
Summary of Observations.—In the preceding chapter we have seen how to obtain the mean monthly temperature from the daily observations, the frequency of the different wind directions for each month, and the total monthly precipitation. The addition of the new instruments, the maximum and minimum thermometers, the psychrometer, the anemometer, and the nephoscope, enables us to obtain the following additional data in our monthly summaries.
Temperature.—The mean monthly temperature may be obtained from the maximum and minimum temperatures as follows: Add together all the daily maximum and minimum temperatures for a month. Divide this sum by the total number of readings you have made of each thermometer (i.e., one reading of the maximum and one of the minimum each day, making two readings a day), and the result will be the mean monthly temperature derived from the maximum and minimum temperature. This is a more accurate mean temperature than the one noted in the summary of the preceding chapter.
Add together all the maximum temperatures noted during one month. Divide this sum by the number of observations, and the result gives the mean maximum temperature for the month.
Table for Meteorological Record.
Transcriber’s Note: To meet size constraints, this table has been here rearranged so the original column headings are now arrayed down the left edge. A reference to a column in the paragraphs below will refer to a row in the table.
A similar operation applied to the minimum temperatures gives the mean minimum temperature for the month.
In meteorological summaries it is customary also to include the absolute maximum and the absolute minimum temperatures, i.e., the highest and lowest single readings of the thermometer made during each month. These can easily be determined by simple inspection of your record book. Note also the dates on which the absolute maximum and the absolute minimum occurred.
The absolute monthly range of temperature is the difference, in degrees, between the absolute maximum and the absolute minimum.
Humidity.—The mean relative humidity is obtained by adding together all the different percentages of relative humidity obtained during the month, and dividing this sum by the whole number of observations of this weather element.
Wind.—The mean velocity of the wind corresponding to the different wind directions is readily obtained by adding together all the different velocities (in miles per hour) observed in winds from the different directions, and dividing these sums by the number of cases. The wind summaries will thus give the frequency of the different directions during each month, and the corresponding mean velocities.
The maximum hourly wind velocity is obtained by inspection of the velocity column.
The total monthly wind movement is readily deduced from the daily records in the twelfth column of the table on p. 44.
State of the Sky.—In connection with the more advanced records described in this chapter, the observations of cloudiness should record the number of tenths of the sky cloudy, as closely as the amount can be estimated by eye, instead of indicating the state of the sky as cloudy, fair, etc. A detailed record of cloudiness in tenths gives opportunity to determine the mean cloudiness for each month, by averaging, as in the case of the other means already described.
If nephoscope observations are made, the monthly summary may include the mean direction of cloud movement for each month. This is obtained by adding together all the different angular measurements of directions of cloud movement, and dividing by the whole number of such observations.
By means of your monthly summaries compare one month with another. Notice how the means and the extremes of the different weather elements are related; how they vary from month to month. Are there any progressive changes in temperature, cloudiness, precipitation, etc., from month to month? What are the changes? Summarize, in a short written statement, the meteorological characteristics of each month as shown by your tables.
Part III.—Exercises in the Construction of Weather Maps
CHAPTER IV.
THE DAILY WEATHER MAP
The first daily weather maps were issued in connection with the Great Exhibition of 1851 in London. The data were collected by the Electric Telegraph Company and transmitted to London over its wires. These maps were published and sold daily (excepting Sundays) from Aug. 8 to Oct. 11, 1851. The first official weather map of the United States Weather Service was prepared in manuscript on Nov. 1, 1870, and on Jan. 14, 1871, the work of manifolding the maps for distribution was begun at Washington. Previous to the publication of this government map, Professor Cleveland Abbe had issued in Cincinnati, with the support of the Chamber of Commerce of that city, the first current weather maps published in the United States (Feb. 24 to Dec. 10, 1870). In France, daily weather maps have been published continuously since Sept. 16, 1863.
Two things are essential for the publication of a daily synoptic weather map; first, simultaneous meteorological observations over an extended area; and, second, the immediate collection of these observations by telegraph. The weather map of the United States is based on simultaneous observations made at about 150 stations in different parts of this country, besides several coöperating stations in Canada, Central America, Mexico, and the West Indies. At each of our stations, whose location may be seen on any weather map, the Weather Bureau employs one or more observers, who, twice a day, at 8 A.M. and 8 P.M., “Eastern Standard Time,” make regular observations of the ordinary weather elements, i.e., temperature, pressure, humidity, wind direction and velocity, precipitation, cloudiness, etc. The instruments at these stations are all standard, but the completeness of the equipment varies according to the importance of the station. The 8 A.M. observations are the only ones now generally used in the preparation of weather maps. When the Weather Service was first established, tri-daily charts were for some time issued from the central office in Washington. On April 1, 1888, the number was reduced to two a day, and on Sept. 30, 1895, a further change was made, and now there is but one map a day.
The 8 A.M. observations, as soon as made, are corrected for certain instrumental errors, and the barometer readings are reduced to sea level. The data are then put into cipher, not for secrecy, but to facilitate transmission and to lessen the chances of error, and are telegraphed from all parts of the country to the central office of the Weather Bureau in Washington. Besides sending their own messages to Washington, all the important stations of the Weather Bureau receive, by a carefully devised system of telegraphic circuits, a sufficient number of the reports from other stations to enable their observers to draw and issue local weather maps.
The observations are received at the central office of the Weather Bureau in Washington by special wires, and are usually all there within an hour after the readings were made. As the messages are received in the forecast room, they are translated from the cipher back again into the original form, and the data are entered upon blank maps. The official charged with making the forecasts then draws upon the maps lines of equal temperature, lines of equal pressure, lines of equal pressure-change and temperature-change during the past 24 hours. These several sets of lines, together with those showing the regions of precipitation during the past 24 hours, furnish the necessary data on which the forecasts can be based. In other words, the forecast official has before him, on the several maps, a bird’s-eye view of the weather conditions over the United States as they were an hour before, and also of the changes that have taken place in these conditions during the preceding 24 hours. Thus, by knowing the general laws which govern the movements of areas of high and low temperature, of fair and stormy weather, across the country, he can make a prediction as to the probable conditions which any state or section of the country will experience in 12, 24, or 36 hours.
In a later chapter some suggestions will be given for studies of forecasting.
The forecasts made in Washington, and printed on the Washington daily weather map, relate to all sections of the United States, and include predictions of cold waves, killing frosts, storm winds, river floods, and the like, besides the ordinary changes in weather conditions. These forecasts, as soon as made, are at once given to the local newspapers and to the press associations. They are also sent by telegraph to all regular stations of the Weather Bureau, and to all stations at which cautionary or storm signals are to be displayed, along the Atlantic or Gulf coasts, and on the Great Lakes.
The Washington weather map is about 24 by 16 inches in size, and is newly lithographed each day. The total number of maps issued from the central office during the fiscal year ending June 30, 1898, was 310,250. In addition to these, there are now 84 stations of the Weather Bureau in different parts of the country, at which daily weather maps are issued and local forecasts made. These latter forecasts are made by a corps of local forecast officials, each of whom has to make the weather prediction for his own district. At first, and until within a few years, one predicting officer in Washington made all the forecasts for the country, but it was found better to have the country divided into geographical sections, over each one of which the meteorological conditions are fairly similar, and to have a local forecast official in charge of each section. These local forecast officials have the double advantage of being able to study the weather conditions over the whole country, as sent them by telegraph each morning, and also of knowing the special peculiarities of their own regions. This enables them to make more accurate predictions than can be made by an official who may be one or two thousand miles distant, in Washington.
The greater portion of the maps issued at the map stations outside of Washington are prepared by what is known as the chalk-plate process, suggested by Mr. J. W. Smith, local forecast official at Boston. This process is as follows: A thin covering of specially prepared chalk, 1⁄8 of an inch in thickness, is spread upon a steel plate of the size of the prospective weather map. On this chalk are engraved, by means of suitable instruments, the various weather symbols, the lines of equal pressure and of equal temperature, and the wind arrows. The plate is then stereotyped in the ordinary way, and printed on a sheet prepared for the purpose, which has a blank outline map of the United States at the top, and space in the lower half for the forecasts, summary, and tables.
The size of the chalk-plate map itself is 10 by 61⁄2 inches; the size of the whole sheet, which includes also the text and tables, 16 by 11 inches. Weather maps prepared by the chalk-plate process are now issued from 28 of the 84 stations which publish daily maps. At the remaining stations the maps are prepared by a stencil process, the size of the map being 131⁄2 by 22 inches. The total number of weather maps issued at the various stations during the fiscal year 1897-1898 was 5,239,300.
Besides recording the usual meteorological data, and publishing weather maps and forecasts, the various stations of the Weather Bureau serve as distributing centers for cold wave, frost, flood, and storm warnings. These warnings are promptly sent out by telegraph, telephone, and mail. Besides these usual methods of distributing forecasts, other means have also been adopted. In some places factory whistles are employed to inform those within hearing as to the coming weather; railway trains are provided with flags, whose various colors announce to those who are near the train fair or stormy weather, rising or falling temperature; and at numerous so-called “display stations,” scattered all over the country, the forecasts are widely disseminated by means of flags.
CHAPTER V.
TEMPERATURE
A. Lines of Equal Temperature.—Temperature is the most important of all the weather elements. It is therefore with a study of the distribution of temperature over the United States, and of the manner of representing that distribution, that we begin our exercises in map drawing. In carrying out the work we shall proceed in a way similar to that adopted by the officials of the Weather Bureau in Washington and at the other map-publishing stations over the country.
Enter on a blank weather map the temperature readings found in the first column of the table in Chapter VIII. These readings are given in degrees of the ordinary Fahrenheit scale [those which are preceded by the minus sign (-) being below zero], and were made at the same time (7 A.M., “Eastern Standard Time”) all over the United States. Make your figures small but distinct, and place them close to the different stations to which they belong. This is done every morning at the Weather Bureau in Washington, when the telegraphic reports of weather conditions come in from all over the country. When all the temperature readings have been entered on the outline map, you have before you a view of the actual temperature distribution over the United States at 7 A.M., on the first day of the series. Describe the distribution of temperature in general terms, comparing and contrasting the different sections of the country in respect to their temperature conditions. Where are the lowest temperatures? Where are the highest? What was the lowest thermometer reading recorded anywhere on the morning of this day? At what station was this reading made? What was the highest temperature recorded? And at what station was this reading made?
Notice that the warmest districts on the map are in Florida, along the Gulf Coast, and along the coast of California. The marked contrasts in temperature between the Northwest and the Pacific and Gulf Coasts at once suggest a reason why Florida and Southern California are favorite winter resorts. To these favored districts great numbers of people who wish to escape the severe cold of winter in the Northern States travel every year, and here they enjoy mild temperature and prevailingly sunny weather. To the cold Northwest, on the other hand, far from the warm waters of the Pacific, where the days are short and the sun stands low in the sky, no seekers after health travel. This annual winter migration from the cities of the North to Florida and Southern California has led to the building of great hotels in favored locations in these States, and during the winter and spring fast express trains, splendidly equipped, are run from north to south and from south to north along the Atlantic Coast to accommodate the great numbers of travelers between New York, Philadelphia, Boston, Chicago, and other large northern cities, and the Florida winter resorts. Southern California also is rapidly developing as a winter resort, and rivals the far-famed Riviera of Southern Europe as a mild and sunny retreat from the severe climates of the more northern latitudes. The control which meteorological conditions exercise over travel and over habitability is thus clearly shown. Florida and Southern California are also regions in which, owing to the mildness of their winter climates, certain fruits, such as oranges and lemons, which are not found elsewhere in the country, can be grown out of doors, and these are shipped to all parts of the United States.
Let us take another step in order to emphasize more clearly the distribution of temperature over the United States on the first day of our series. Draw a line which shall separate all places having a temperature above 30° from those having temperatures below 30°, 30° being nearly the freezing point and, therefore, a critical temperature. Evidently this will help us to make our description of the temperature distribution more detailed. If this line is to separate places having temperatures above 30° from those having temperatures below 30°, it must evidently pass through all places whose temperature is exactly 30°. Examine the thermometer readings entered on your map to see whether there are any which indicate exactly 30°. You will find this reading at Norfolk, Va., Wilmington, S. C., Atlanta, Ga., Chattanooga, Tenn., Ft. Smith, Ark., and Portland, Ore. Through all these stations the line of 30° must be drawn. Begin the line on the Atlantic Coast at Norfolk, Va., and draw it wherever you find a thermometer reading of 30°. It is best to trace the line faintly with pencil at first, so that any mistakes can be easily rectified, and it should be drawn in smooth curves, not in angles. From Norfolk the line must run southwest through Wilmington, and then westward through Atlanta, passing just north of Augusta, which has 31°. From Atlanta the line goes northwest through Chattanooga, and thence westward, curving south of Memphis (28°) and Little Rock (26°), and then northwestward again through Ft. Smith.