Полная версия
Digital transformation for chiefs and owners. Volume 2. Systems thinking
The introduction of lean manufacturing, as well as digitalization in general, mainly causes stress and stiff resistance among staff. We went through the first book.
6 sigma
Six Sigma is the American approach to production management, where the main goal is to reduce the number of rejects to 3—4 units per 1 million units of finished products.
This tool is based on the processing of statistical data and the work with measurable indicators, which is generally characteristic of the American management culture. Here they say: «the right process gives the right results».
The main effect of using 6 sigma is the ability to distinguish the boundaries of the managed process. And in the case of detection of the problem to understand where is a system error and where is a private case, which allows not to treat force majeure excessive measures for the whole system. Just because one employee shows up at lunch doesn’t mean everyone has to be fined five minutes late. If there is one failure per million hours of work in an IT solution, it is not advisable to reassemble the whole system. Additionally, it is also a tool that allows us to identify, analyse and implement beneficial developments to improve the overall process.
Rule 3 sigma
Therefore, what are the «sigms» about?
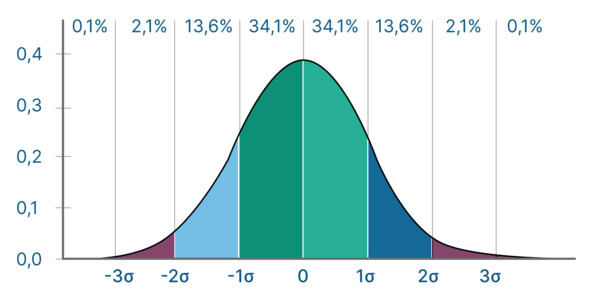
Sigma (σ) is the letter of the Greek alphabet, which in mathematics denotes a standard deviation, that is, when indicators do not conform to this deviation, they are an anomaly.
Rule 3 Sigma states (in simplified terms): Virtually all values and results that can be considered normal for this process lie within a range of +– 3 sigma of the mean. If you plunge into the calculations, it turns out that all normal for the process results will be in these 3 sighs with a probability of 99.73%.
Algorithm of calculation 6 sigma
– Add all measured values and calculate the arithmetic mean.
– We consider the difference between the maximum and minimum values, for example, for a month.
– We consider the same difference for another, for example, 5 months.
– We calculate the average of this difference for 6 months.
– In Shuhart’s control cards (GOST R 50779.42—99) we find the index d2, and take the value for the sample, in our example it is 6 months, so d2 = 2.534.
– Take our average difference between maximum and minimum and divide by d2.
– We get a sigma.
– From the mean value of paragraph 1, we shall now defer 3 sigma to the right and to the left. We get six sigmas that show the boundaries of our managed process. What’s not inside is the deviations. We investigate the causes and work with them. Additionally, if we don’t like the boundaries of the process, we work systematically.
Of course, in life it is not always necessary to use all tools in full compliance.
Here’s a practical example from my practice.
What is on the input: the table with the data about the drilling of wells. Records in it about two hundred.

Additionally, on the basis of this data, it is necessary to understand what is happening at all? What are the problems? Unfortunately, it is impossible to conduct interviews with people.
Well, let’s go over a simple algorithm.
– Make a small panel in which we consider the duration of key periods.

– We calculate the main indicators.

– Then we build graphs of Pareto (with some clearing of anomalies), see what is the average wait between drilling and development (simple).
– Calculation and construction of the graph 6 sigma (but it is not necessary, all the necessary data is there). Defining the boundaries of a managed process and its current state. We find out whether it is necessary to make adjustments to the process or its complete restructuring?
– We determine the causes of deviations falling outside the boundaries of the process, including using the technique «5 Why». Determine whether processes need to be changed (e.g., procurement of ZIP).
– We also study the reasons for the best examples, determine the possibility of adjusting processes and setting new targets, standards. We also study the situation with the biggest downtimes, see who implemented, what went wrong, why. It is possible that there are the same people, and you need to work locally with them, for example, to teach them.
Yet, what conclusions could be drawn, even without deep calculations?
– According to Pareto’s schedule, we saw that in more than 75% of cases the waiting was within 73 days, and in 85% of cases – up to 154 days. Of course, it is better to calculate the sigma optimally, but in the current version the manageability boundaries of the process are visible. Accordingly, arithmetic averages can be used for the first approximation.
– We have no information about the depth of the wells and cannot assess the efficiency of the working process. However, we can compare the downtime between the end of drilling and the beginning of development. Thus, the average waiting time from the end of drilling to the beginning of development is 76 days. At the same time, the average expected start of development exceeds the average development period by more than 3.5 times and is comparable in time with the entire drilling process. The cumulative expectation loss is 42% of the cycle time from the start of drilling to completion. This generates both lost profits and direct losses.
– The reason is the system problems of the planning process, detailed audit is necessary.
– Possible system limitations:
– system of control and notification of the process stages;
– no system for forecasting the completion of drilling phases;
– lack of regulations and target values for the duration of each phase, notification time, delivery and readiness of the equipment for transition to development.
Here’s how one table can be calculated and learned to reach certain conclusions. As the informal communication showed, they were correct conclusions. However, I have not gone to the further project: the TOPs have been negotiating for almost six months, and in my opinion, if they do not know how to work quickly upstairs, something to change from below is meaningless. Everything comes from the head. In this I am convinced of every project, so I always start working from the first person. First we prepare it, and then we work with the team, only this approach gives results.
Lean Six Sigma
Lean Six Sigma – a hybrid that combines Japanese and American concepts:
– Lean Manufacturing (Lean) – Process Loss Reduction and Acceleration, Standardisation and Continuous Development, Working with People and Thinking;
– 6 sigm (Six Sigma) – Improving product quality and customer loyalty; the basis is information analysis, measurable performance.
In fact, as a basic education engineer, I think the best solutions are hybrids. There are no clean methodologies that are fully applicable to life. It is impossible to use any tool at 100%, it becomes redundant and too expensive pleasure. The calculation of boreholes given above took me one evening. As a result, I got an understanding of the problem. Could you go deeper, spend 2—3 nights on an analyst, but would change from this end result? Unlikely. Additionally, this is already losses in lean production – excessive processing.
Chapter Summary 3
Of course, not all the tools are listed here, and in the same 6 sigm concept you can go deeper to the control cards Shuhart, DMAIC, DMADV, what are the roles of the staff (green, black belts, masters, etc.), and in lean production – SIPOC and Poka-yoke, «House TPS» (tools and principles), but I think it would be a bit much for you, my reader. You’re not an executive, you’re a supervisor. That means that your people need to know the specific tools, and you need to understand how it works to be able to set the right tasks and delegate, control and ask for the result.
The main purpose of this chapter is to diffuse the fog before the mysterious thrifty production and show that it is an excellent tool in an integrated management system. Additionally, if we first optimize lean manufacturing processes and then use digital tools to focus on eliminating losses and working with people, collecting feedback from them, the effect of this approach will not be measured in a few tens of percent, several times.
As I mentioned the example, understanding what losses should be eliminated, how to collect information from the bottom and support it sometimes with free tools, you can save business millions of rubles. So, in 4 months we completely excluded unearmarked work from the production manager, and this is more than 1 million rubles a year, while he began to do what he should – the organization of the work of the division. Same goes for the foreman.
If it is still interesting to go deeper, then the QR code and link will lead to the corresponding article.

Lean production. Part 2 +6 Sigma
Chapter 4. Project management
Introduction
In general, digitalization and digital transformation are a project in themselves. When you want to do something, you haven’t done before, when you’re limited in time and resources, it’s a project. You want to write a book, buy a car, go on vacation to a new place, that’s a project. You start a new business; you decide to change the department – it’s a project.
Project management is like riding on rides: sometimes fun, sometimes exciting, sometimes come out with full pants. If the control becomes chaos, then it is clearly not fun and you can lose your pants, especially given the cost of digital technology.
Any project consists of stages of initiation, planning, implementation (control) and closure. Additionally, for each stage there are tasks. Plus, you have to choose the right implementation methodology and remember that the project is a triangle.
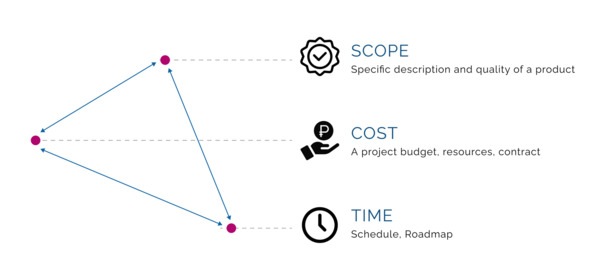
Project management triangle – it is impossible to change one item and not change the rest
The essence of this triangle is that you cannot change the content of a project (except in rare cases) without changing the timing or budget. Or you cannot reduce the term without changing the budget (to attract additional people, for example) or maintenance. That is, any your wish will necessarily affect the content, timing or cost.
Let’s talk about this. x4x4
Project management is best characterized by the Russian proverb «long harness, fast drive». Additionally, if you don’t, miss the first stages, then you will be in one ditch, a cart in another, and the horse will run away.
According to my personal observations, the majority of projects suffer from poor management. Let’s say that you have correctly identified where to implement IT, the technology itself, the key effects, but here comes the introduction and…
To be frank, it was with project management that my path in digitalization began, and it was this direction of management that I mastered the most deeply. As a result, I have experience with both startups and giants: LUKOIL, Gazprom, Ministry of Energy, Mazda-Sollers. Additionally, I can say with certainty that in industry we do not know how to manage projects: choose the wrong organization. structures, methodologies, focus on formal tools, do not elaborate goals, objectives, resource availability, risks… However, don’t think we’re alone. The Standish Group has reached the following conclusions about the causes of project failures after having studied more than 50,000 projects worldwide:
– Lack of Resources
This is a typical story – let’s initiate the project, and how to implement, we will understand later. So, I had a project in one corporation that involved 7,500 people, which we accompanied with the help of Excel. Should we talk about this fun adventure, and what quality of data was there?
– Unrealistic Terms
I think everyone knows «had to yesterday». Unreal deadlines are not so bad if we keep in mind that they will be disrupted, and try to become better. However, as practice shows, this approach is almost not followed.
– Errors in the formulation of the objectives
As a rule, the objectives are either vague or vague, and there is an error in the causal relationship, and the objectives do not reflect the objectives to be achieved.
– Not enough detailed planning
If you think about it, this is the reason for all the other points.
– The quality of interaction within the team is poor
Unfortunately, within corporations, people are used to formal communication, through notes and correspondence. Additionally, most problems could be solved simply by normal communication before the aftereffects.
– Change of objectives during the project
Again, with proper planning of the initiation and planning stages, this can be avoided. After all, people are extremely poorly tolerated by chaos and uncertainty.
Project management statistics
First of all I want to give a diagram of the statistics of project management.

Project management statistics
Moreover, if you dive deeper into research, then from the 1990s to the early 2000s, the dynamics were positive, and then everything stalled. Even by industry, the situation does not differ significantly.
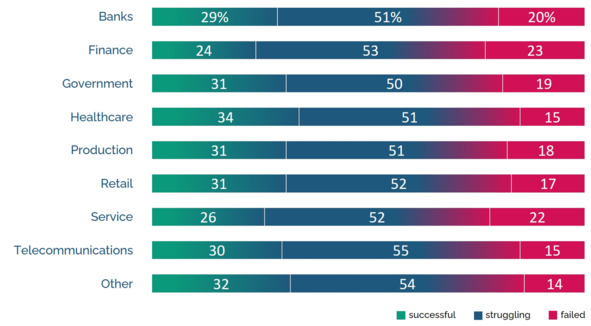
Statistics by industry
The dependence of success on project size and methodology
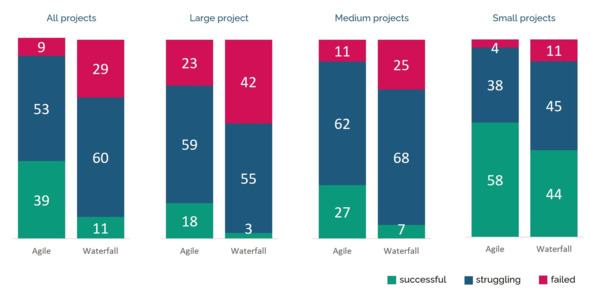
The dependence of success on project size and methodology
Let’s look at our companies. All gravitate to mega projects and, preferably, on a cascade (waterfall) model. What it is and what is the difference, let’s analyze in this chapter.
Even more interesting are the statistics on time and cost overruns.
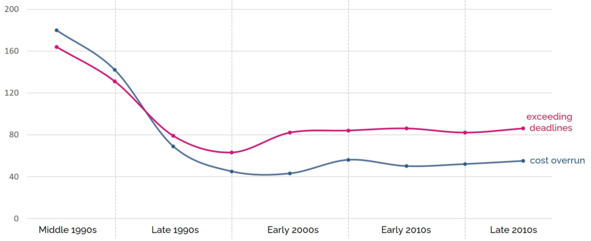
Statistics on time and cost overruns
That is, on average, the budget is over half, and the timeline – almost twice. And this is exactly what project managers say informally.
It turns out, in order to successfully implement projects on digital transformation, it is better to do not megaproject, but a large number of small on flexible methodologies. It’s unusual, isn’t it? It requires a completely different corporate culture than what we’re used to seeing.
At the same time, the competence of the project management becomes more and more obligatory, it cannot be ignored, and here is why:
– the share of projects in GDP, for example, in the UK, increased from 5% to 35% in 100 years;
– the global trend is not to sell individual products, but complex projects. And we are behind in this direction for a whole generation. If everyone comes to the fact that it is necessary to sell not a gas turbine, and service turnkey, with delivery, installation, all auxiliary equipment, maintenance organization, we still sell the iron, and then – the customer’s care;
– according to some projections, by 2030 up to 60% of the time of a top-level manager will be spent on projects;
– at the same time, according to the recommendations of the standards and my observations, mistakes made and not corrected at the beginning of the project can be guaranteed to bury it. I’ve been through dead projects, and I’ve been pulling out «troublemakers». The cost of the same changes increases from 10 nominal rubles at the initiation and planning stage to 10,000 at commissioning. The ability to correct errors is reduced. Therefore, modern methods provide for up to 30—40% of the time of the entire project for its planning and risk development.
Possible approaches and standards for project management
In the world and in particular in Russia there are several standards and approaches to project management:
– Standards on the competence of the manager:
– ICB standard from IPMA (International Project Management Association);
– STK standard from OWNET, which is a translation of ICB.
2. Standards that build processes:
– PMBOK from PMI
– ISO 21500 from ISO is a summary of PMBOK (100 pages instead of 500+)
– P2M from PMAJ – both pro and pro projects. Focused on the values that should get by the end of implementation.
– Prince2, developed by the authors of ITIL, a standard for the management of IT services.
There is also Agile as a set of principles and tools aimed at flexibility in the face of uncertainty and the need to test hypotheses, with a powerful psychological basis within.
If simplified, the approaches to the implementation of projects can be divided into:
– Waterfall model;
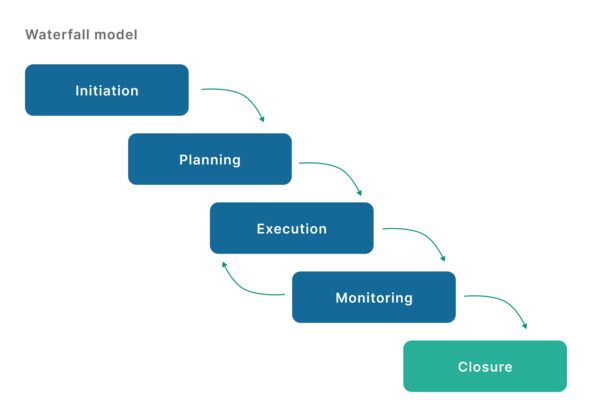
Cascade approach to project implementation – delivery of project product at the end of implementation
– hybrid;
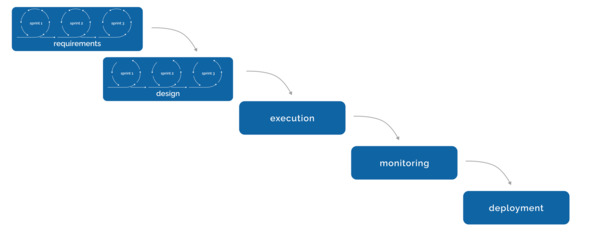
Example of a hybrid approach with iterations at the requirement collection / initiation and design / project planning stage
– Agile.
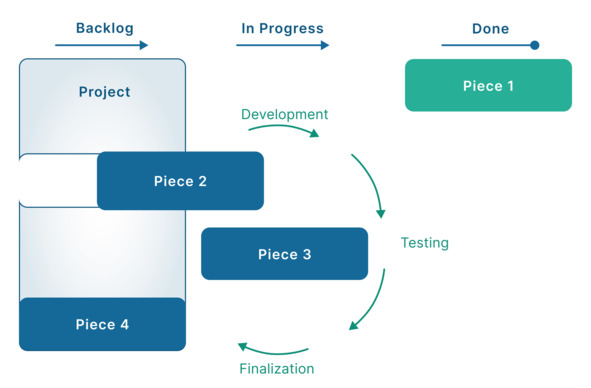
An example of a flexible approach to project implementation
In turn, flexible approaches can also be decomposed into 3 types: iterative, incremental, iterative-incremental.
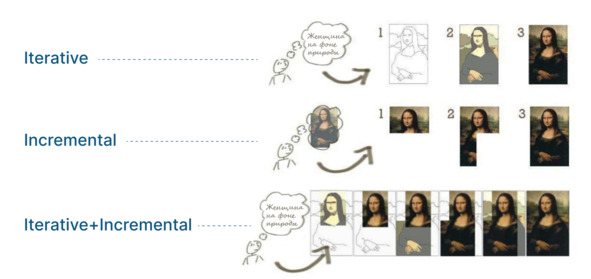
3 subtypes of a flexible approach to project implementation
At the same time, according to various studies, in life mostly (60—70%) used hybrid methods. Pure approach is very little, and it is normal, because it is impossible to create a universal tool for all occasions.
How to choose the right approach?
Before going through the basic approaches, I want to share one, essentially, key tool that allows you to understand at an early stage which project is in front of you, which standard or hybrid is more appropriate to apply.
It is a Kenevin model (Cynefin framework) that distinguishes five types of systems: Simple (Simple), Complex (Complicated), Confusing (Complex), Chaotic (Chaotic) and Random (Disorder).
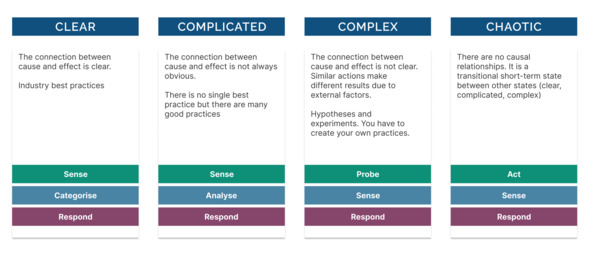
Kenevin model
1. Simple system
Characteristic: Causal relationships are clear and unambiguous.
What we do, we get the best practices.
Order of Action: Understand – Classify – React.
Examples: repetitive and relatively simple projects, such as paving the sidewalk in the yard, webinar.
You can use any «cascade» standard. The main thing – not to be seduced by simplicity and do not neglect planning and points of control.
2. Complex system
Characteristic: Causal relationships exist but are not always obvious.
What we do: we use good practices and standards. There is no single «best practice», but there are many «good practices».
Action Sequence: Understand – Analyze – React.
Examples: ERP system implementation, production line reconstruction.
Here you need to comply with the requirements of PMBOK, Prince2, P2M, work with stakeholders and risks.
The «flexible» methodologies could lead to unreasonable budget overruns and delay. However, they can be used as part of a «hybrid» approach.
3. Complicated system
Characteristic: Cause-effect relationships are not clear. Similar actions lead to different results due to external factors.
What we’re doing is, there’s a field for hypotheses and experiments. In such systems, it is difficult to rely on historical information and individual observed facts. It is necessary to invent the practice of achieving results.
The order of action in this environment: Explore – Understand – React.
Examples: developing a new mobile app, entering a new foreign market, creating a bill in the field of artificial intelligence.
This is the territory of Agile and Scrum. Clear technical tasks do not fit here. Flexibility and awareness of risks, deviation from strict requirements are needed.
It will be a lot to communicate with the customer. As a rule, he himself does not fully understand what he needs. The final product may differ significantly from the original plan.
This is one of the reasons for the problem of IT implementation in large companies. Everything is done on paper, with budget restrictions. As a result, they come to uncomfortable and expensive in content and no budget for improvement, which is explained by the following points:
– Made according to the original requirements, which means the project can be considered successful. What other investments can be made?
– In bureaucratic organizations, it is almost impossible to grasp the fallacy of original desires or of understanding what is really needed. And when the mistake is finally revealed, they look for the culprit to punish.
– The limitations of budgetary rules. Who has faced this, understands what the problem is and how much it consumes time.
4. Chaotic environment (crisis, innovation)
Characteristic: No causal relationships. This is a transient short-term state, either to simple or complex systems (by means of strict restrictions) or to a confusing environment (by means of point measures).
The order of actions in this environment: Act – Understand – React.
What we do: The first step in chaos is action. The goal is to reduce chaos. Then it is necessary to feel the result of this action and to react in order to transfer the system from a chaotic state to a confusing or ordered one. There’s just no time to test hypotheses, and chaotic systems are incredibly fast.
The result depends on the literacy, courage and innovation of the thinking of particular managers.
5. Disorderly environment
It is particularly difficult to recognize because of the many competing options. The recommendation is to divide it into parts and to determine the context in which each of the parts relates.
Types of organizational structures
To choose the right project management standard, you need not only to determine in which environment it will be implemented, but also the type of your organizational structure:
– Weak – a lot of projects, but they are small, without routine, not critical for the company. Or just one project that purposely takes 10—20% of the company’s resources. If you look at the model of Keenevin, it is suitable for simple systems. Such a structure is particularly demanding to develop a communication plan between the participants and to receive feedback from the project manager, who is usually not a senior manager.
– Balanced – medium projects that can take 20—50% of the company’s resources. If you look at the Kinevin model, these are complex and confusing systems. You can also apply to chaotic structures, but you have to evaluate the project. For example, implementing an ERP or separate digital projects.
– Strong – strategic projects where the price of error is high for the company, and a large number of resources (more than 50%) is required. These are, for example, transformation programs, complex automation, implementation of lean production systems and so on. Here, it is essential to work through the initiation and planning phase, to make short milestones between phases and to remain flexible.


